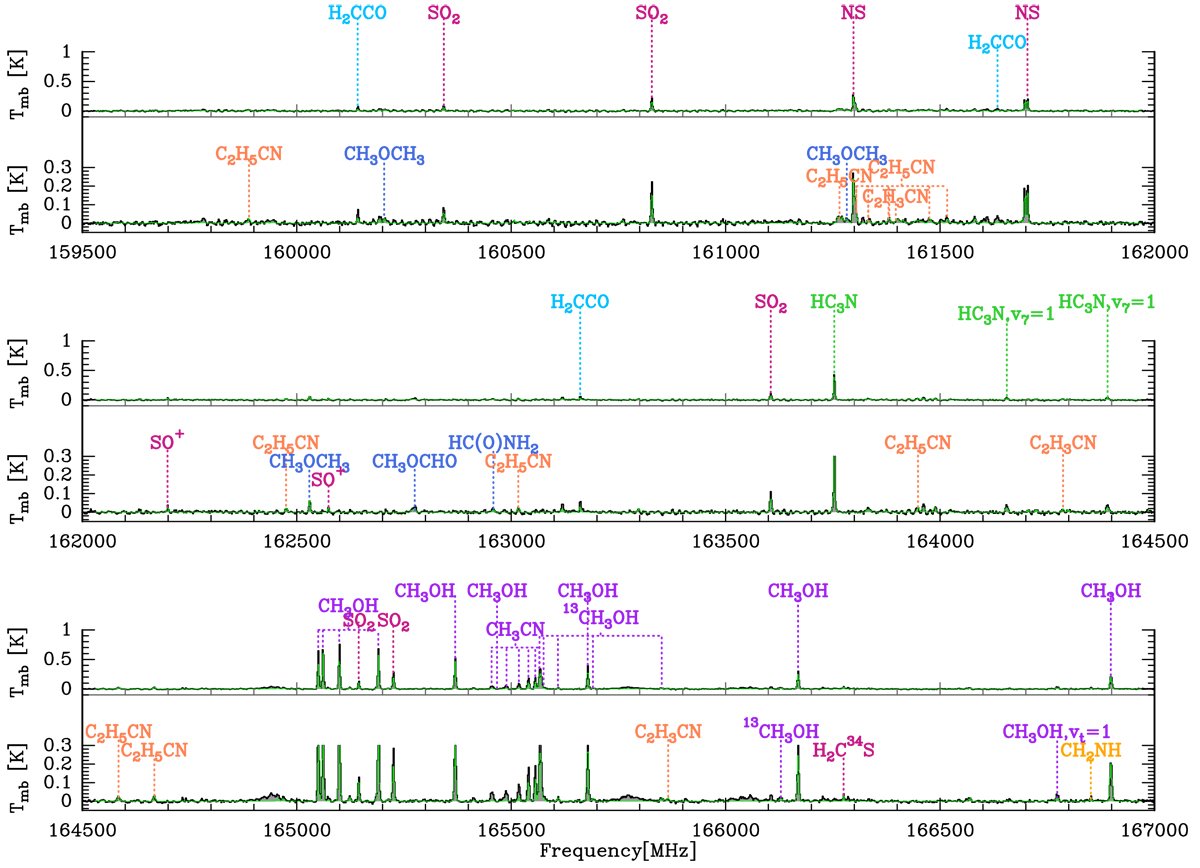
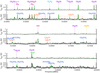
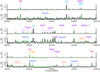
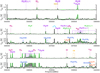
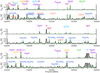
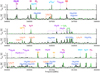
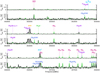
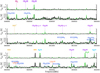
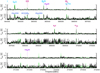
Fig. C.1
Download original image
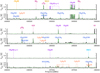
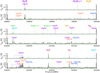
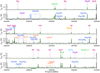
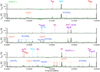
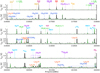
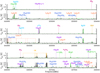
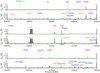
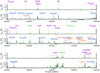
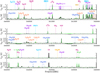
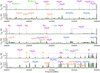
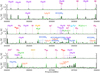
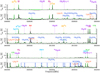
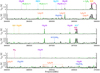
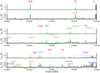
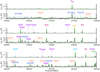
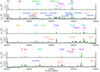
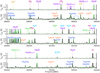
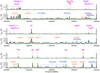
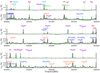
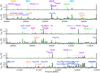
Spectrum towards G328.2551-0.5321. The grey filled histogram shows the spectra and the coloured labels the detected transitions of all the light molecules and some transitions of the COMs. The green line represents the LTE model obtained with Weeds. The upper panel for each frequency range shows the labels for the small molecules, and the lower panel corresponds to a zoom in temperature for better visibility of the COMs that are labeled.
Current usage metrics show cumulative count of Article Views (full-text article views including HTML views, PDF and ePub downloads, according to the available data) and Abstracts Views on Vision4Press platform.
Data correspond to usage on the plateform after 2015. The current usage metrics is available 48-96 hours after online publication and is updated daily on week days.
Initial download of the metrics may take a while.