Fig. 18
Download original image
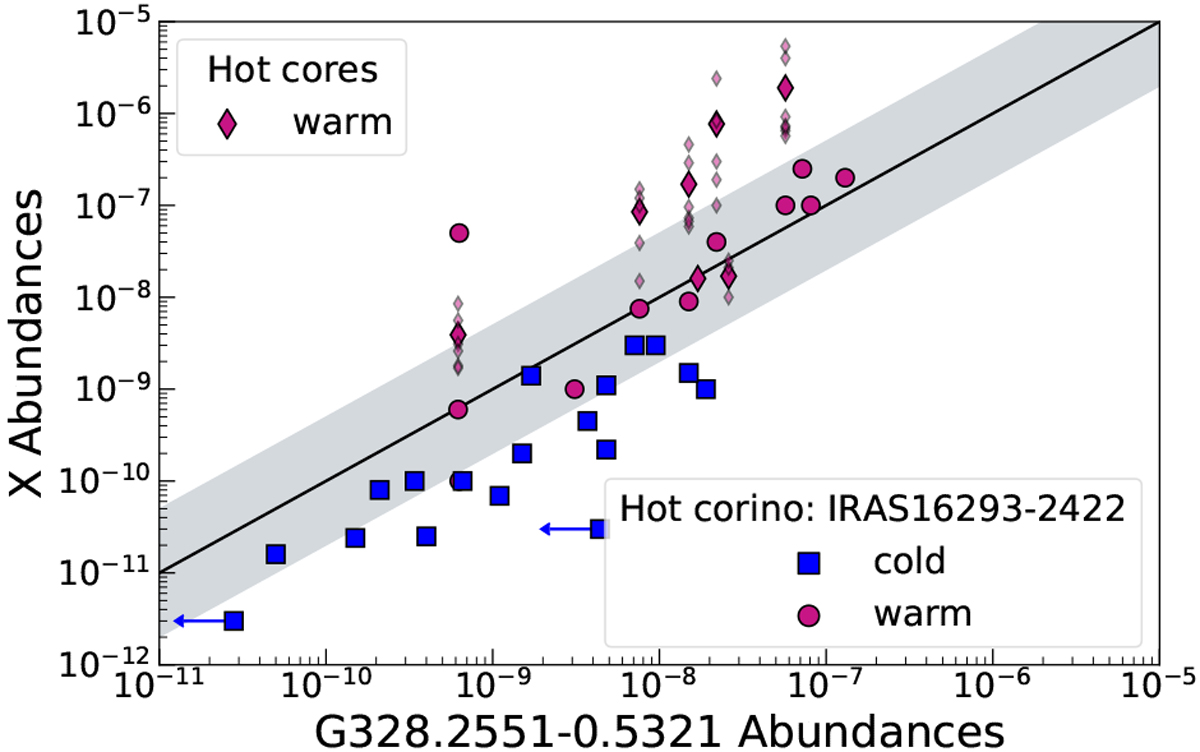
Molecular abundances relative to H2 towards IRAS 16293-2422 (Schöier et al. 2002; Maret et al. 2005; Jaber et al. 2014; Taquet et al. 2014; Majumdar et al. 2016) and hot cores from Bisschop et al. (2007) vs. that of G328.2551-0.5321. The diamond represents the COMs in the hot cores. The small symbols are used to show each hot core. The larger symbol shows the averaged value. The blue data points represent the cold component of the envelope, and red represents the warm component of the envelope. The grey shaded region corresponds to a factor of 5 scatter from the one-to-one relation.
Current usage metrics show cumulative count of Article Views (full-text article views including HTML views, PDF and ePub downloads, according to the available data) and Abstracts Views on Vision4Press platform.
Data correspond to usage on the plateform after 2015. The current usage metrics is available 48-96 hours after online publication and is updated daily on week days.
Initial download of the metrics may take a while.