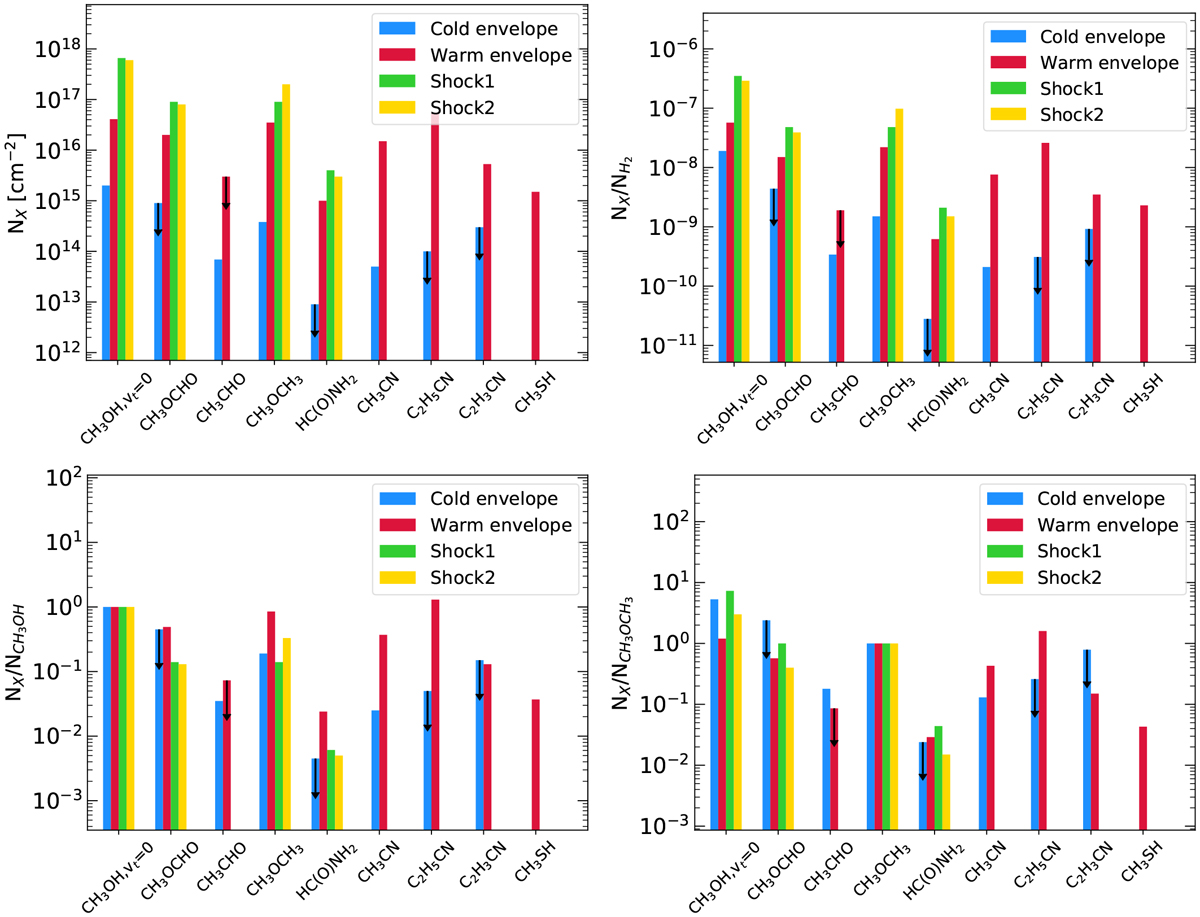
Fig. 17
Download original image
COM column densities (top left panel) and abundances relative to H2 (top right panel), methanol (bottom left panel), and dimethyl ether (bottom right panel). Only the main isotopologues are represented. The cold and warm components of the envelope are described by the blue and red histograms. The two shocks are represented in yellow and green. The upper limits are indicated by the black arrows.
Current usage metrics show cumulative count of Article Views (full-text article views including HTML views, PDF and ePub downloads, according to the available data) and Abstracts Views on Vision4Press platform.
Data correspond to usage on the plateform after 2015. The current usage metrics is available 48-96 hours after online publication and is updated daily on week days.
Initial download of the metrics may take a while.