Fig. 16
Download original image
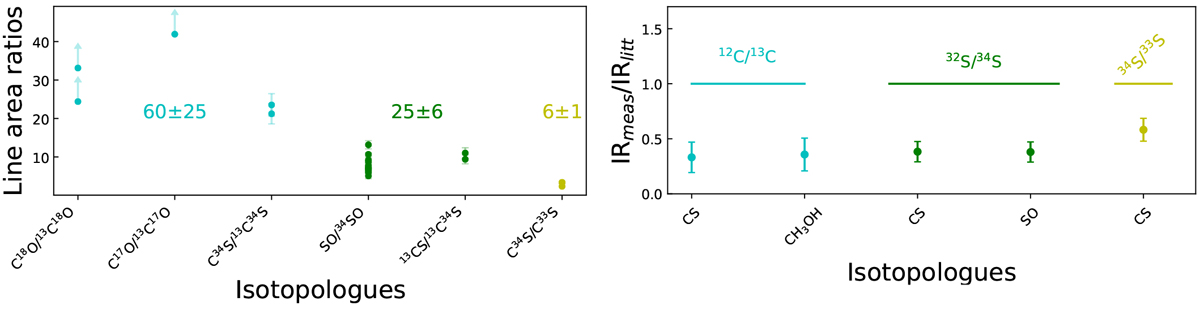
Line area ratio for the pairs of isotopologues (left panel). The ratios expected at the galactocentric distance of G328.2551-0.5321 from galactocentric variation measurements are indicated (see Table 6 for references). The error bars represent the errors on the line area given by the Gaussian fitting procedure from CLASS. Right panel: ratio of the measured isotopie ratio obtained from the LTE modelling of the column densities and the ratios expected at the galactocentric distance of G328.2551-0.5321 from galactocentric variation measurements. The error bars represent a 20% error on the column densities.
Current usage metrics show cumulative count of Article Views (full-text article views including HTML views, PDF and ePub downloads, according to the available data) and Abstracts Views on Vision4Press platform.
Data correspond to usage on the plateform after 2015. The current usage metrics is available 48-96 hours after online publication and is updated daily on week days.
Initial download of the metrics may take a while.