Fig. 10
Download original image
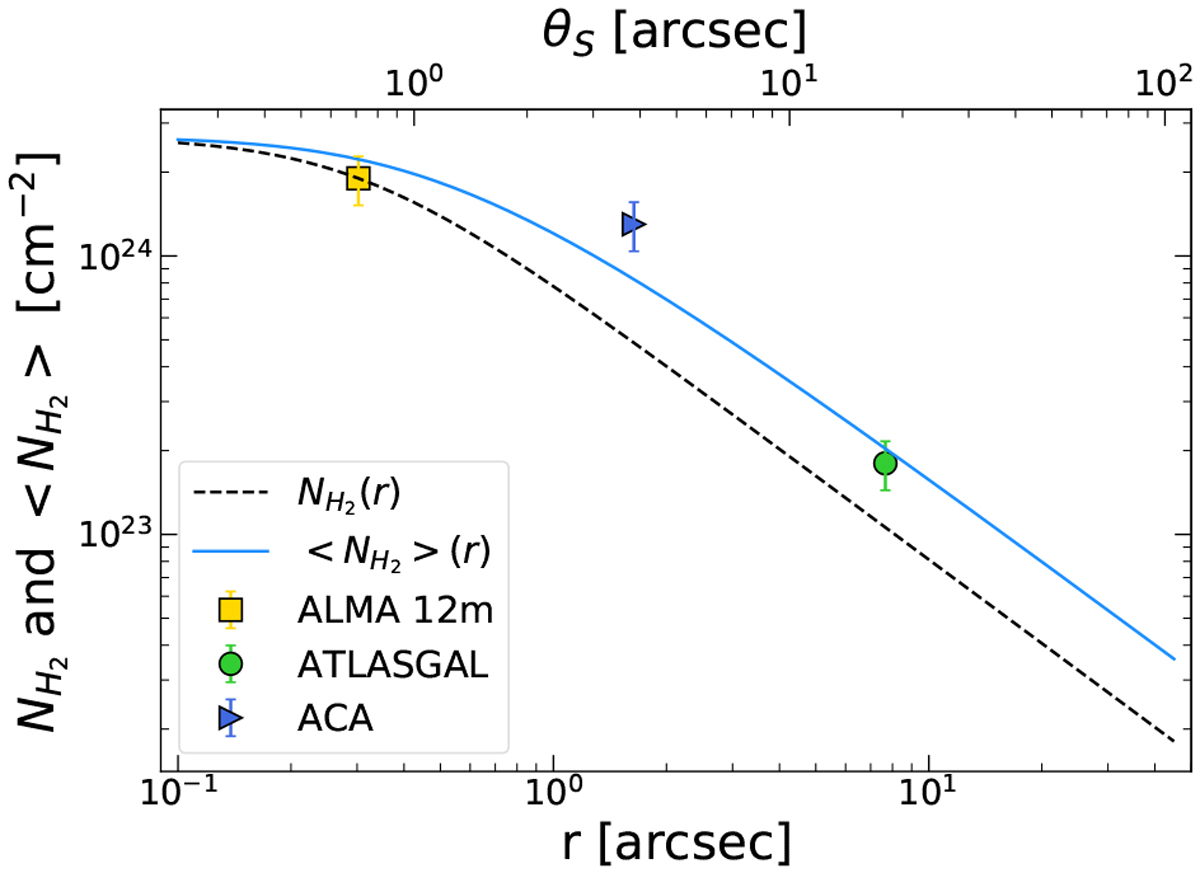
Column density profile (dashed black line) and averaged column density (blue line) vs. radius (r). The blue triangle shows the averaged column density estimate from ACA array observations from Csengeri et al. (2017a). The green circle corresponds to the beam-averaged column density estimated from ATLASGAL (Csengeri et al. 2014). The yellow square shows the column density estimates roughly at the position of the accretion shocks with ALMA (Csengeri et al. 2019). The error bars indicate a 20% error on these measurements.
Current usage metrics show cumulative count of Article Views (full-text article views including HTML views, PDF and ePub downloads, according to the available data) and Abstracts Views on Vision4Press platform.
Data correspond to usage on the plateform after 2015. The current usage metrics is available 48-96 hours after online publication and is updated daily on week days.
Initial download of the metrics may take a while.