Open Access
Fig. 1
Download original image
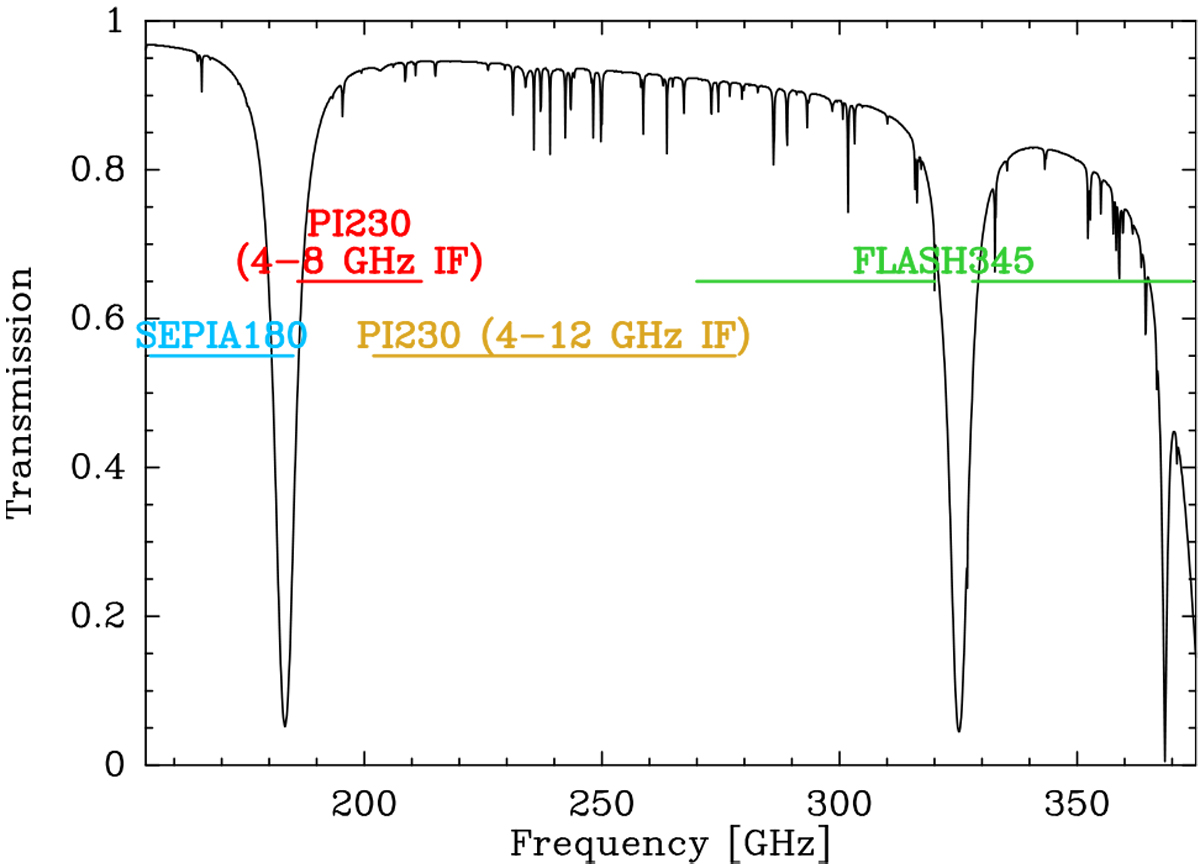
Continuous frequency coverage of the spectral survey. The black curve shows the atmospheric transmission as computed by the ATM model written by Juan Pardo (Pardo et al. 2002) with a water vapour of 1.2 mm.
Current usage metrics show cumulative count of Article Views (full-text article views including HTML views, PDF and ePub downloads, according to the available data) and Abstracts Views on Vision4Press platform.
Data correspond to usage on the plateform after 2015. The current usage metrics is available 48-96 hours after online publication and is updated daily on week days.
Initial download of the metrics may take a while.