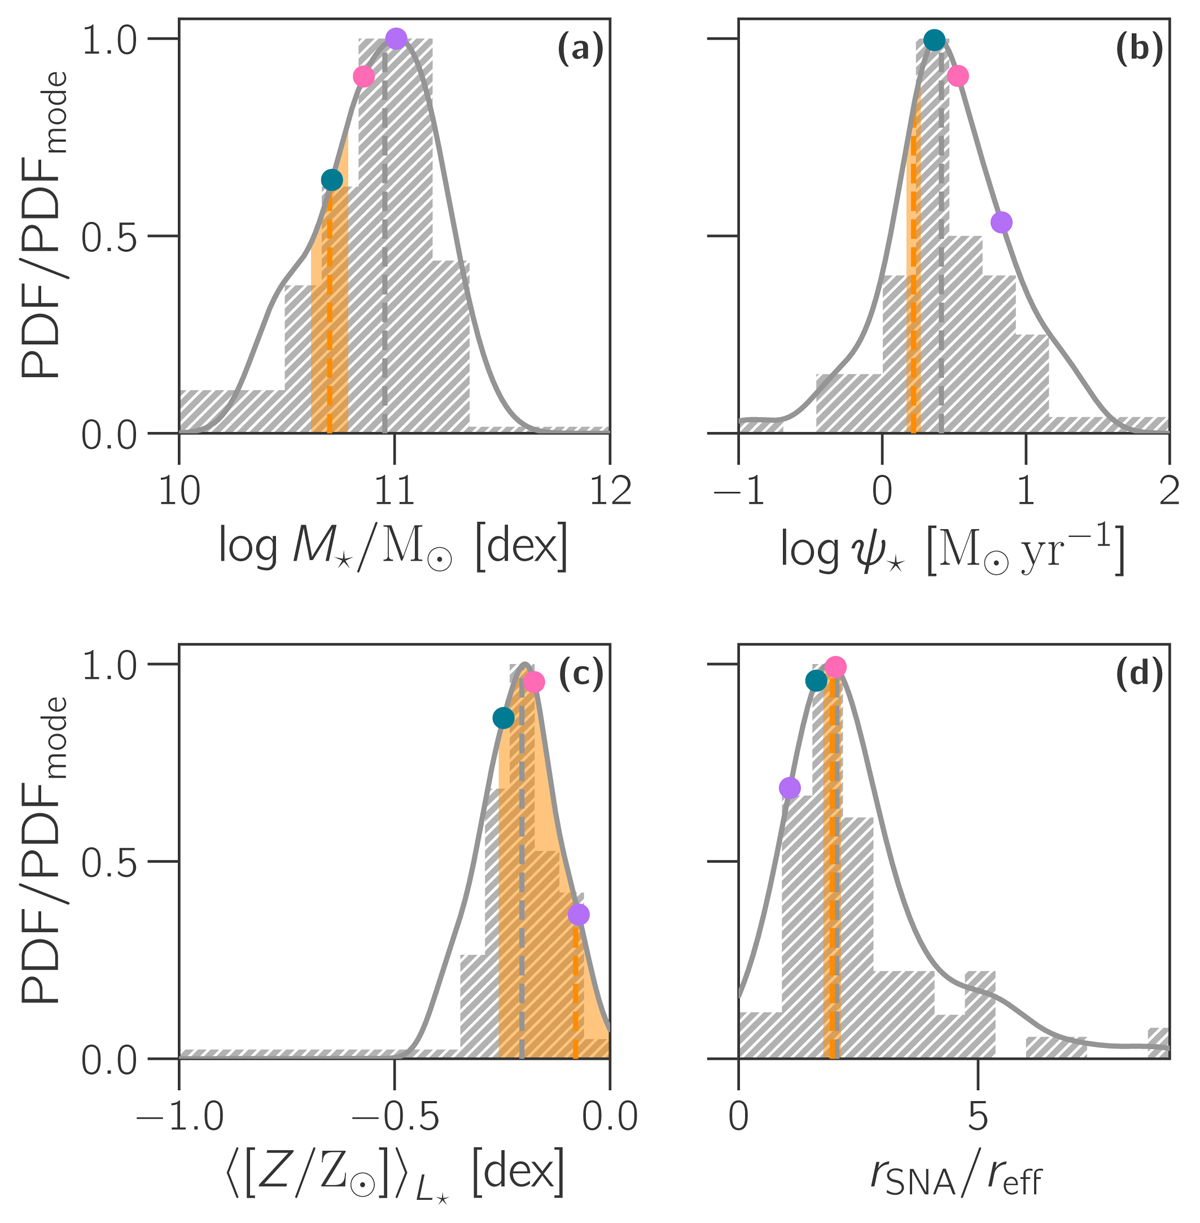
Fig. 2.
Download original image
Distributions of global stellar mass (a) and SFR (b); and local luminosity-weighted stellar metallicity (c) and galactocentric distances (d) normalized by the host effective radius for the 61 host and SNAs (gray shaded histogram and density plot), respectively. The corresponding median of each distribution is shown (gray dashed line). The three example galaxies from Fig. 1 are also highlighted (circles). The vertical orange region indicates the galactocentric distance of the Sun with respect to the reff of the MW (±1σ) around the best estimate (orange dashed line).
Current usage metrics show cumulative count of Article Views (full-text article views including HTML views, PDF and ePub downloads, according to the available data) and Abstracts Views on Vision4Press platform.
Data correspond to usage on the plateform after 2015. The current usage metrics is available 48-96 hours after online publication and is updated daily on week days.
Initial download of the metrics may take a while.