Fig. 1.
Download original image
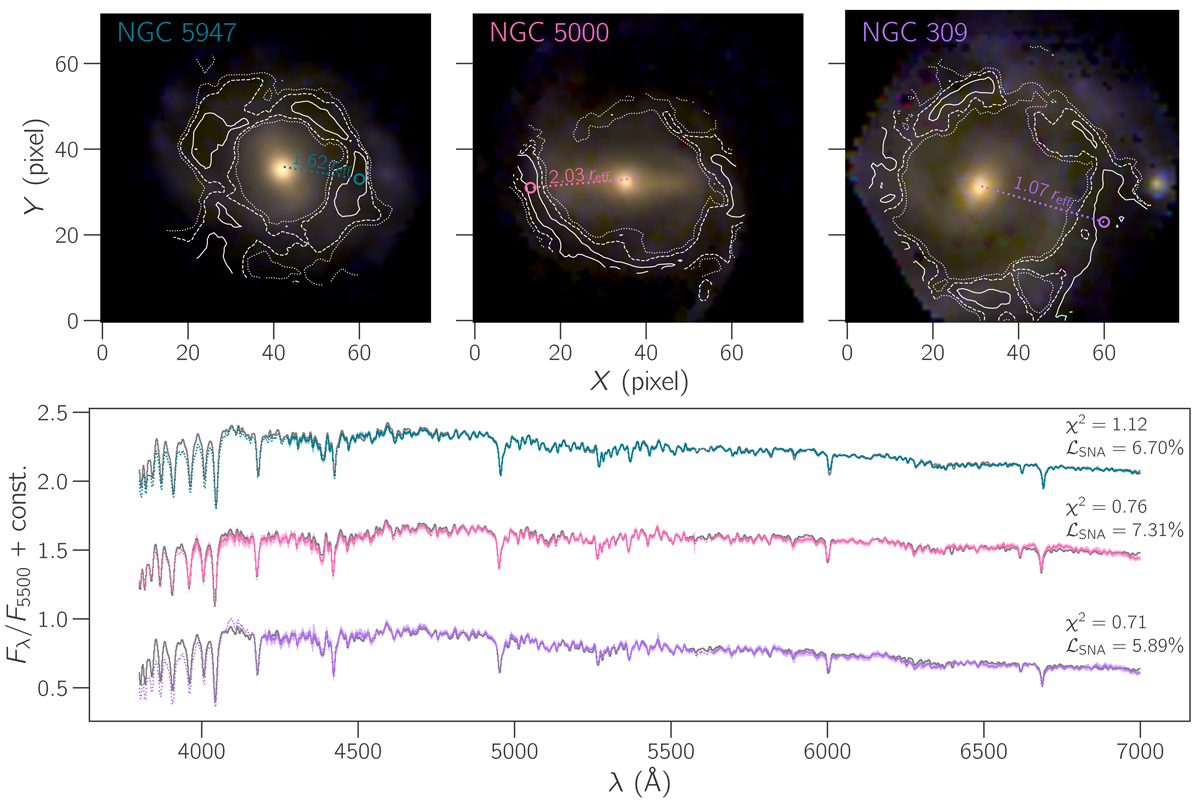
Demonstration of our method for finding SNAs with three sample galaxies in our golden sample. Top panels: RGB (R: 6450 Å, G: 5375 Å, and B: 3835 Å) composite images of galaxies NGC 5947, NGC 5000, and NGC 309 in our golden sample described in Sect. 2.3 which likely hosts SNA regions. The likelihood map is overlaid in each case with contours enclosing the 1σ (solid), 2σ (dashed), and 3σ (dotted), respectively. The location of the maximum likelihood in each case (colored circle) and its galactocentric distance (dashed colored line) are shown. Bottom panel: spectrum corresponding to the maximum likelihood spaxel (solid line in color) along with the propagated (1σ) error spectrum (shaded region). We highlight the regions where the error spectrum was masked out (dotted). The SNA spectrum (gray) calculated as described in Sect. 2.4 is also shown. The resulting χ2 and the likelihood integrated within a circular aperture matching the SN physical scale around the maximum are also shown.
Current usage metrics show cumulative count of Article Views (full-text article views including HTML views, PDF and ePub downloads, according to the available data) and Abstracts Views on Vision4Press platform.
Data correspond to usage on the plateform after 2015. The current usage metrics is available 48-96 hours after online publication and is updated daily on week days.
Initial download of the metrics may take a while.