Free Access
Fig. 6
Download original image
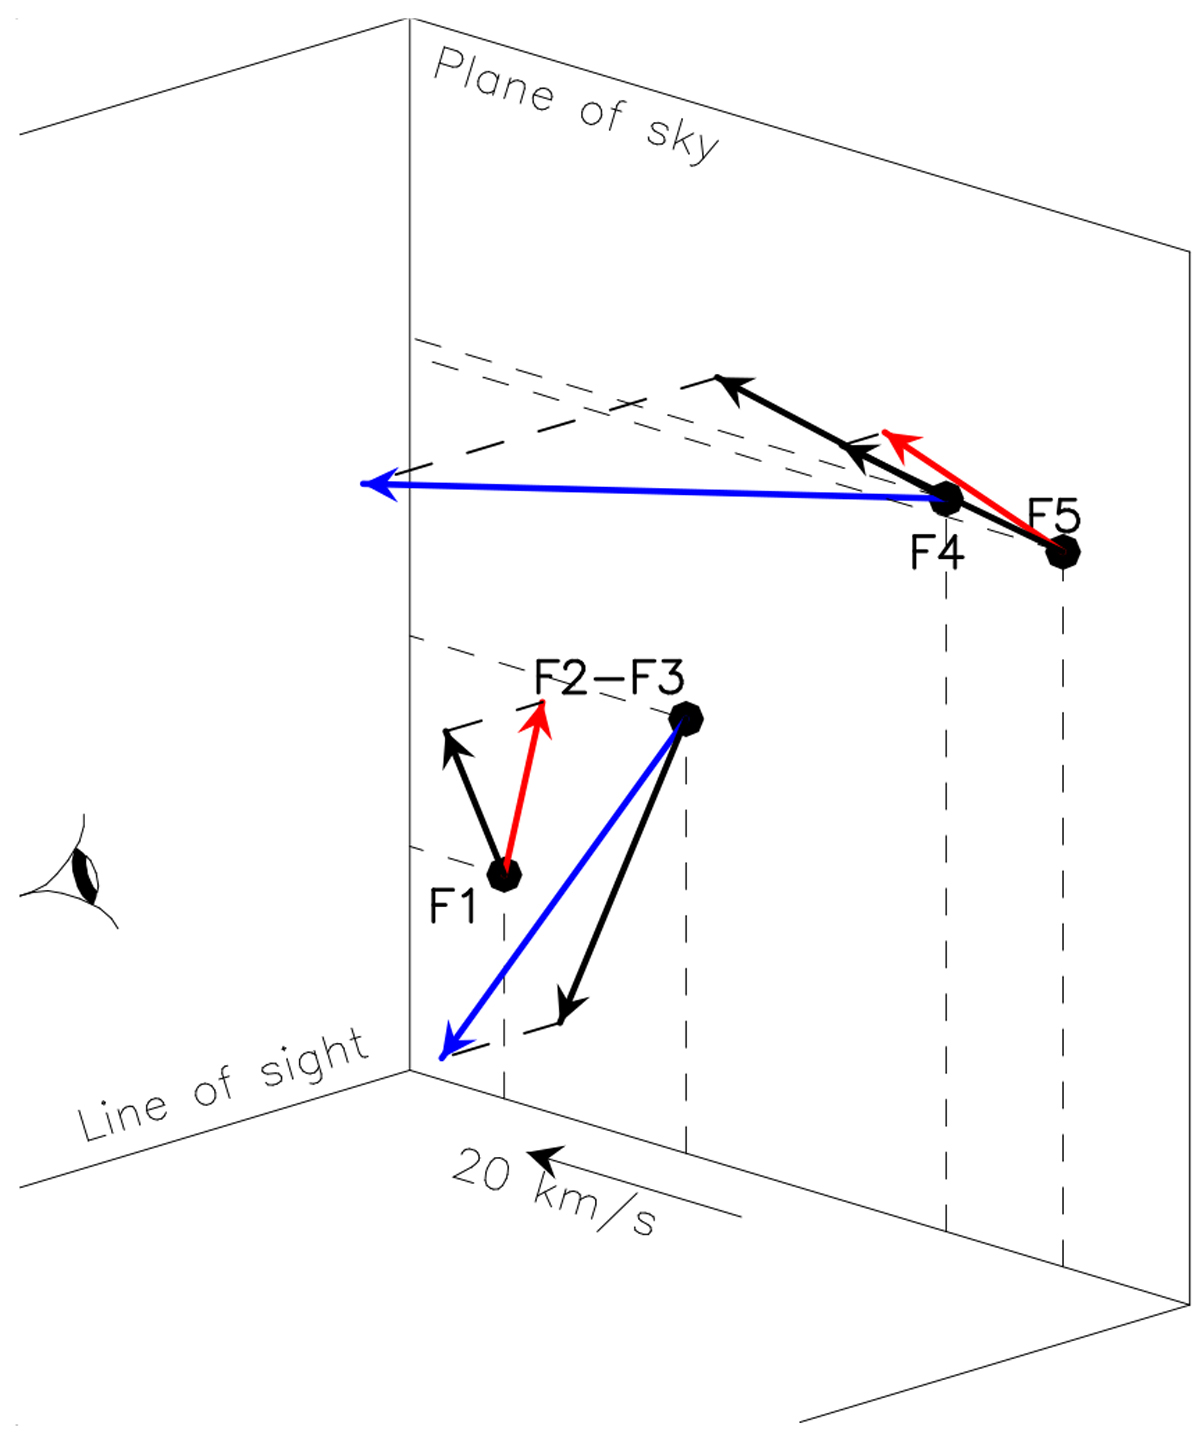
Sketch of the 3D velocities of the pre-collision knots F1, F2-3, F4, and F5 of the eastern lobe of outflow S. The black arrows are velocities in the plane of the sky derived from the proper motions. The blue and red arrows are the 3D velocities, with a radial component toward and away from the observer, respectively.
Current usage metrics show cumulative count of Article Views (full-text article views including HTML views, PDF and ePub downloads, according to the available data) and Abstracts Views on Vision4Press platform.
Data correspond to usage on the plateform after 2015. The current usage metrics is available 48-96 hours after online publication and is updated daily on week days.
Initial download of the metrics may take a while.