Fig. 4
Download original image
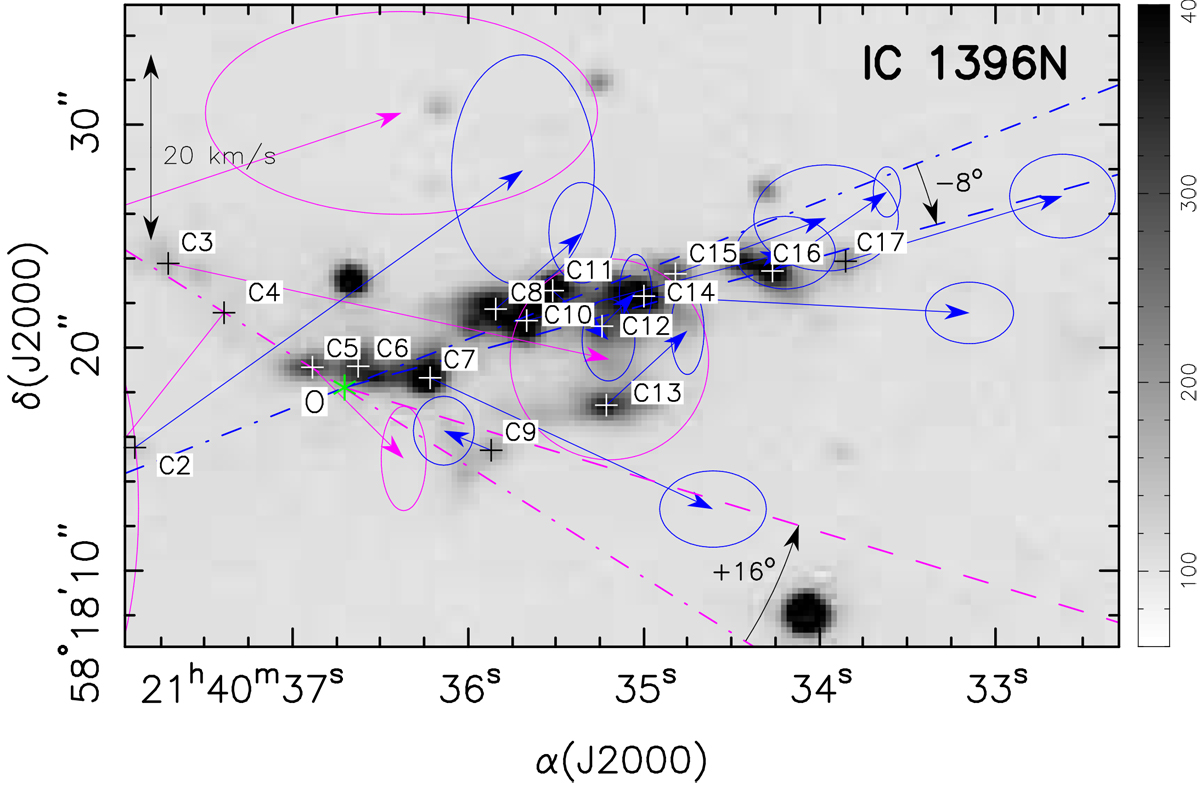
Zoomed-in view of Fig. 3, showing the knots in the area of interaction between the two outflows and their proper motions. The blue-lobe pre-collision axes of outflows N and S are indicated respectively by the magenta and blue dash-dotted lines. Their intersection, the collision point O, is marked with a green asterisk. The dashed lines show the post-collision axes of outflow N (magenta) and outflow S (blue) (see Table 3).
Current usage metrics show cumulative count of Article Views (full-text article views including HTML views, PDF and ePub downloads, according to the available data) and Abstracts Views on Vision4Press platform.
Data correspond to usage on the plateform after 2015. The current usage metrics is available 48-96 hours after online publication and is updated daily on week days.
Initial download of the metrics may take a while.