Free Access
Fig. 1
Download original image
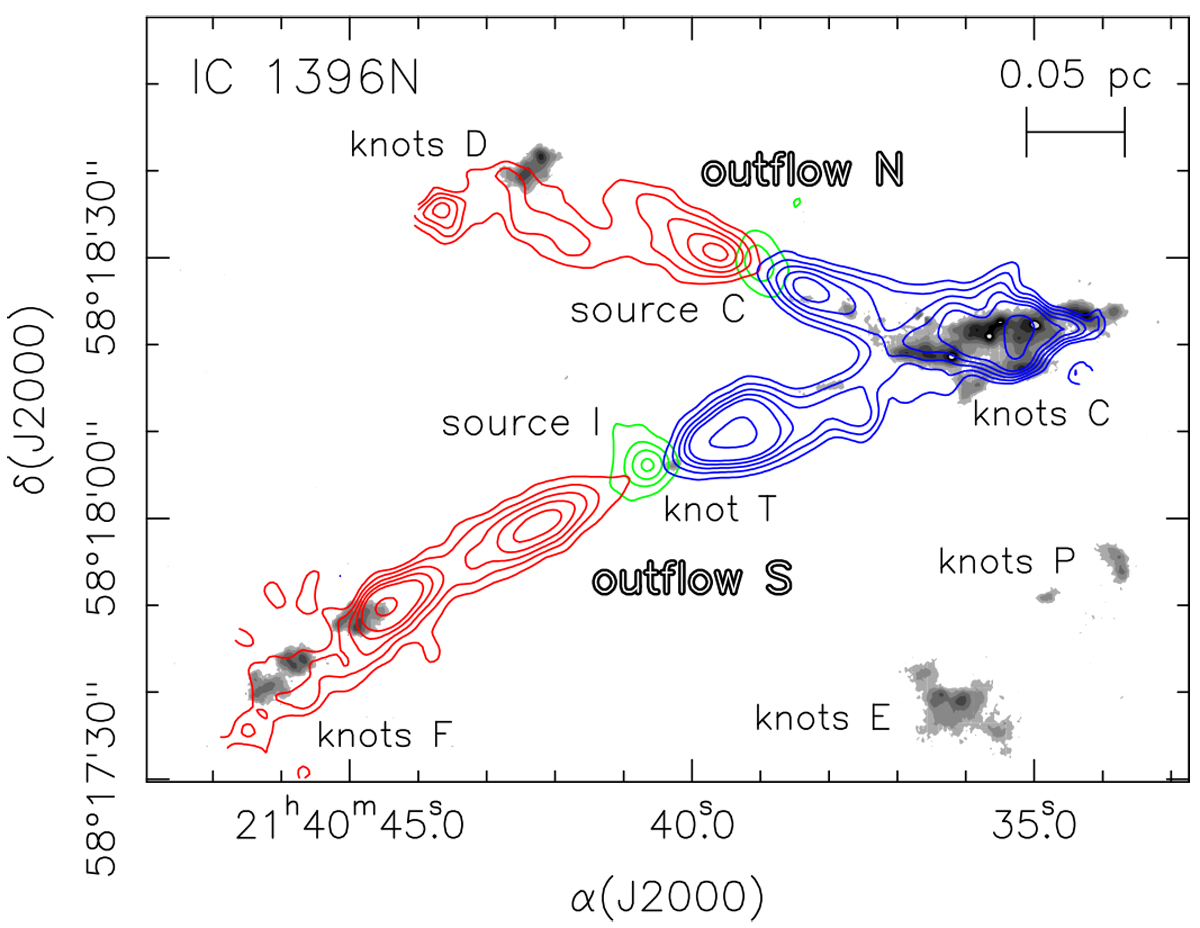
CO outflows (red and blue contours), dust continuum emission (green contours), and H2 emission (grey scale) from Beltrán et al. (2012). Source C traces the driving source of outflow N, while source I traces the driving source of outflow S.
Current usage metrics show cumulative count of Article Views (full-text article views including HTML views, PDF and ePub downloads, according to the available data) and Abstracts Views on Vision4Press platform.
Data correspond to usage on the plateform after 2015. The current usage metrics is available 48-96 hours after online publication and is updated daily on week days.
Initial download of the metrics may take a while.