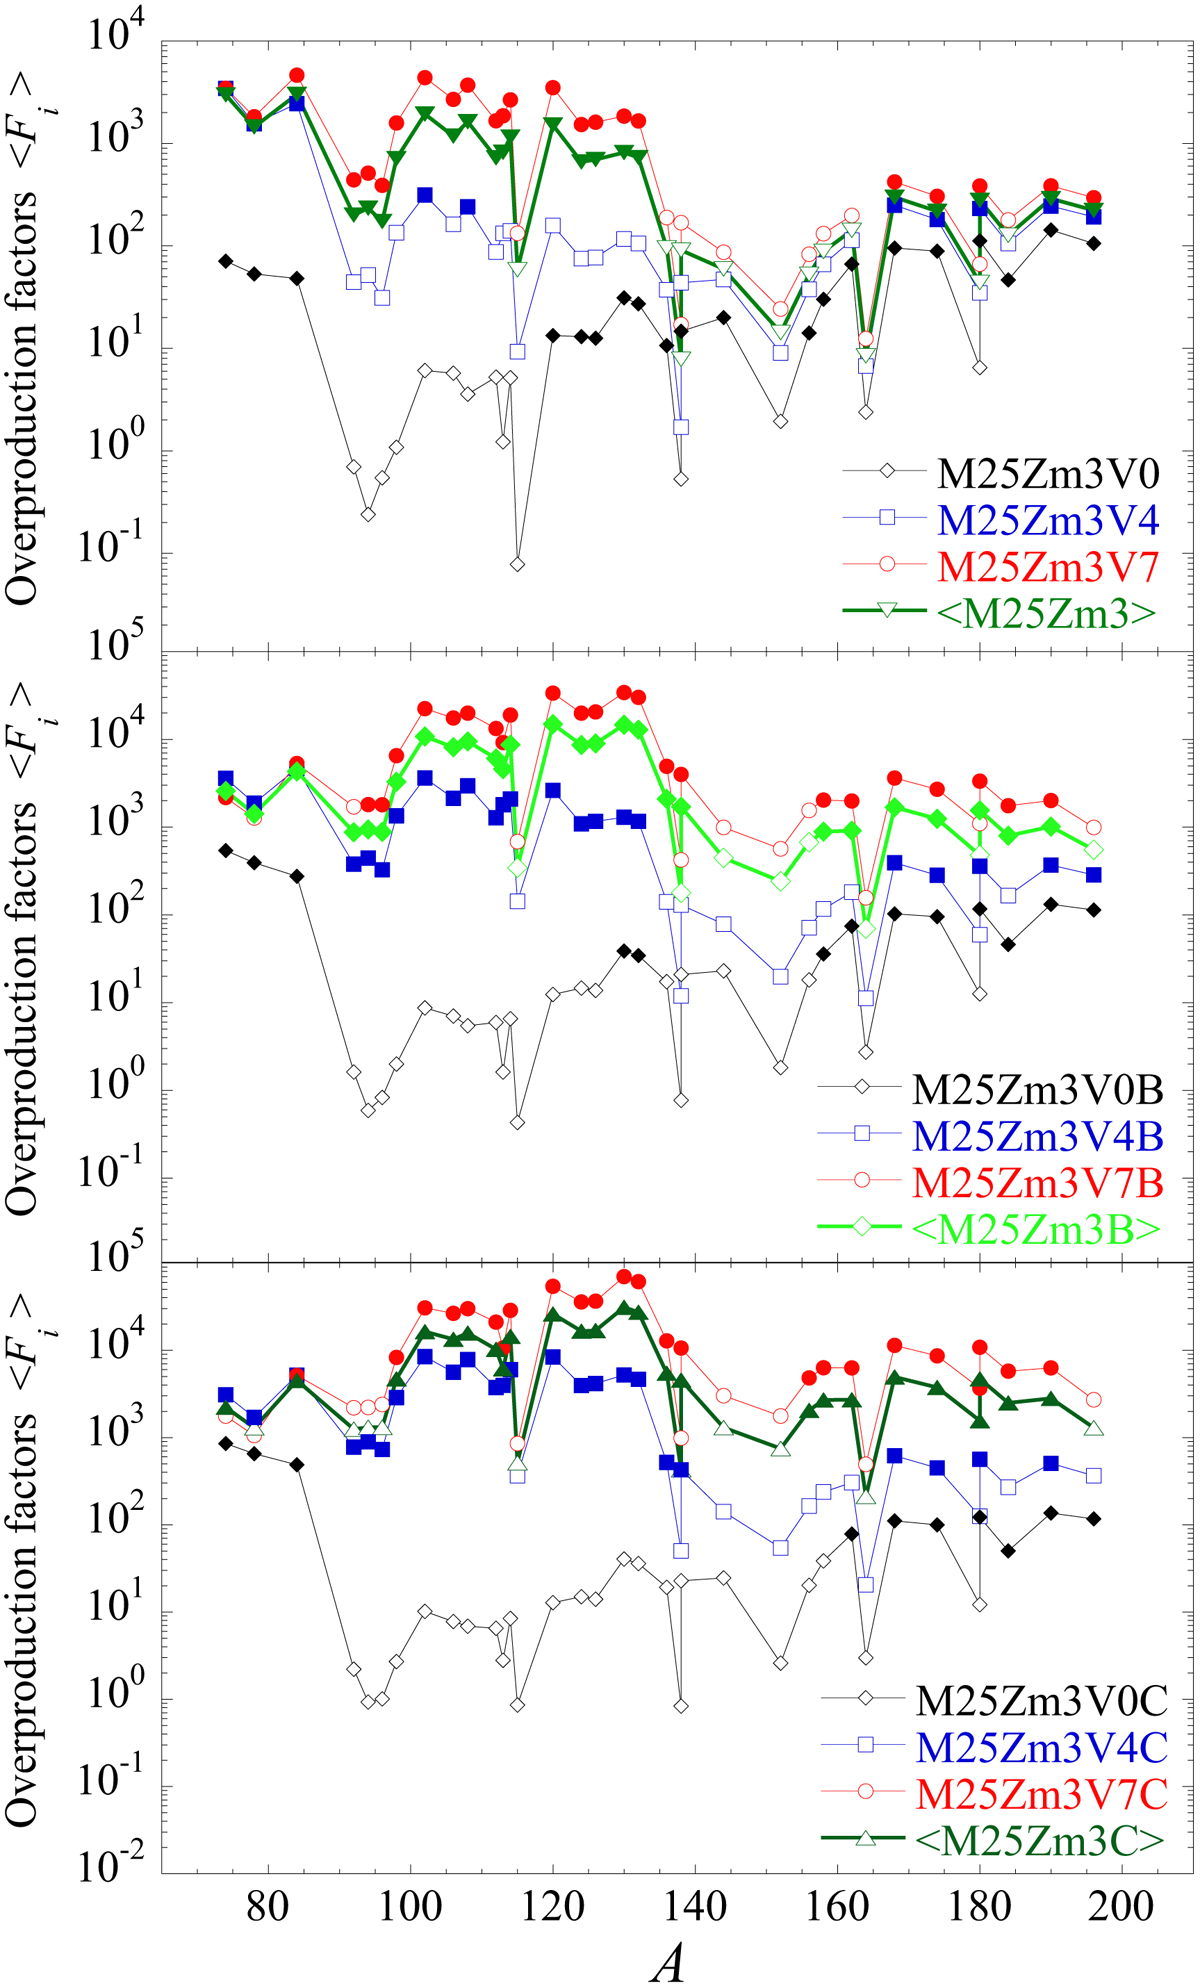
Fig. 9.
Download original image
Overproduction factors ⟨Fi⟩ (Eq. (1)) mass-averaged over all PPLs for all p-nuclides when considering the 17O(α,γ)21Ne rate of Best et al. (2013, top panel), Best et al. (2013) divided by 10 (middle), and Taggart et al. (2019, bottom panel). The filled symbols highlight the npp-nuclides (Table 2) that have the highest overabundances, i.e. those with ⟨Fi⟩ higher than the highest value divided by an arbitrary factor of 20. The green curves show the velocity-averaged yields over the three 25 M⊙ models assuming they follow the rotational distribution of observed young B stars from Huang et al. (2010, their Fig. 6). See text for more details.
Current usage metrics show cumulative count of Article Views (full-text article views including HTML views, PDF and ePub downloads, according to the available data) and Abstracts Views on Vision4Press platform.
Data correspond to usage on the plateform after 2015. The current usage metrics is available 48-96 hours after online publication and is updated daily on week days.
Initial download of the metrics may take a while.