Free Access
Fig. 8.
Download original image
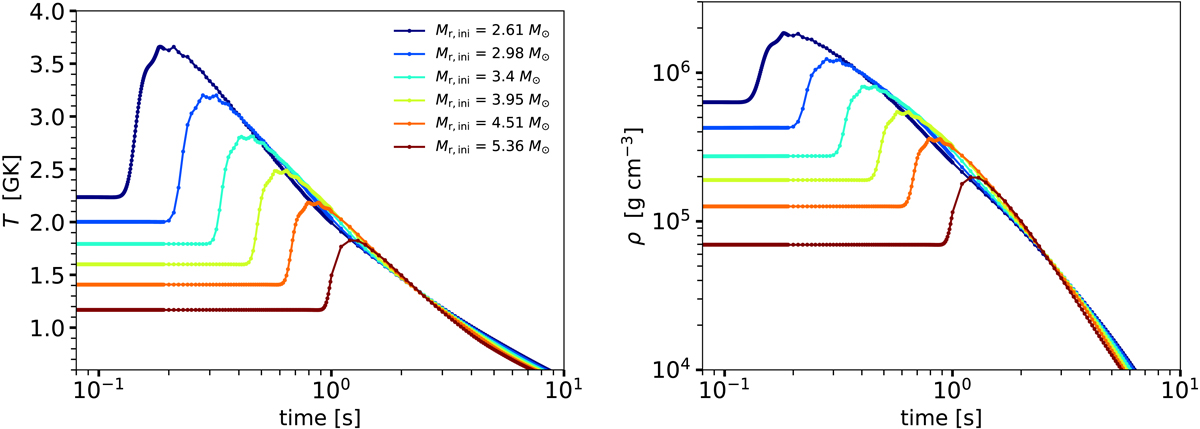
Temperature (left panel) and density (right panel) evolution of several tracer particles coming from the M25Zm3V4 explosion model. The maximum temperature of these particles during the explosion verifies 1.8 < Tex, max < 3.7 GK. These particles are initially located in the cyan area in Fig. 1 (right panel).
Current usage metrics show cumulative count of Article Views (full-text article views including HTML views, PDF and ePub downloads, according to the available data) and Abstracts Views on Vision4Press platform.
Data correspond to usage on the plateform after 2015. The current usage metrics is available 48-96 hours after online publication and is updated daily on week days.
Initial download of the metrics may take a while.