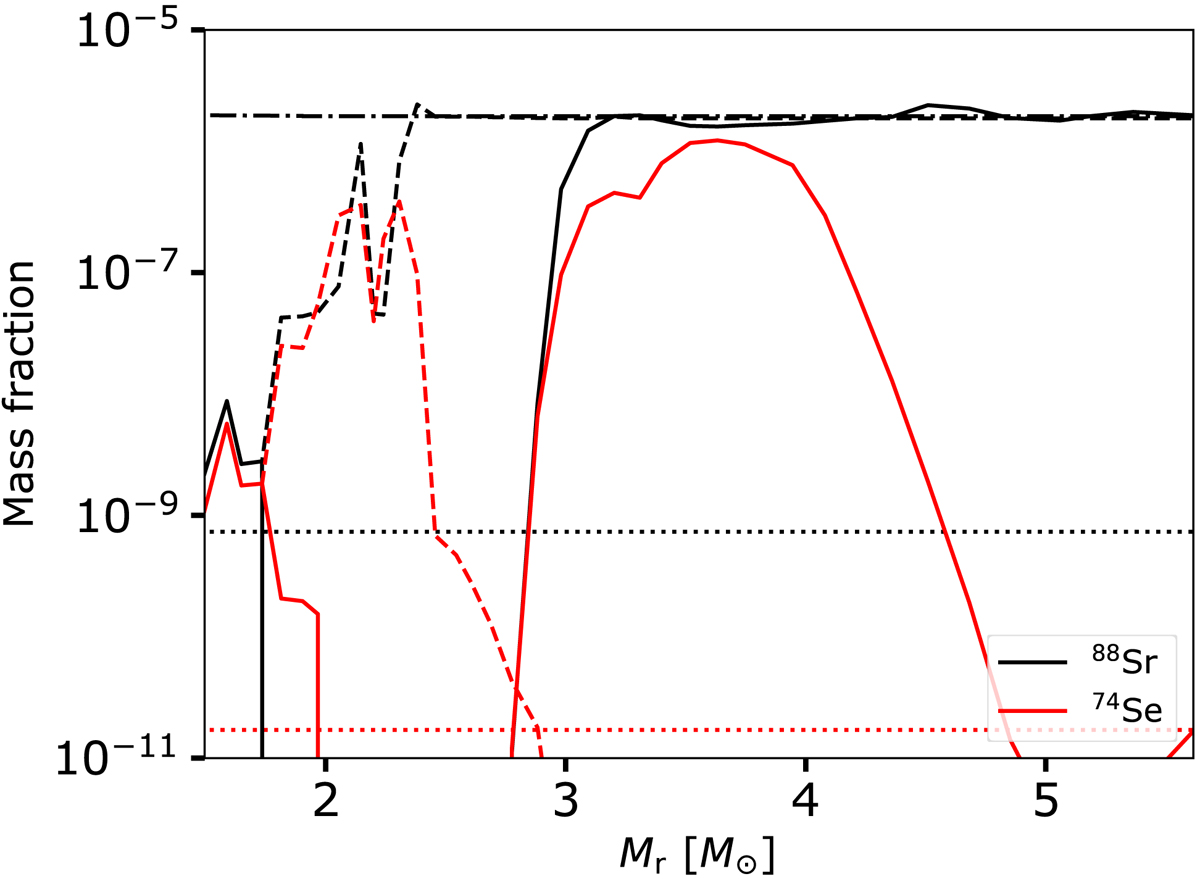
Fig. 6.
Download original image
Abundance profiles of the s-nuclide 88Sr (black) and the p-nuclide 74Se (red) in the region of the star that is relevant for the p-process. The abundance profiles are shown at four different stages: at the birth of the star (or zero-age main-sequence, dotted lines), at the start of core oxygen burning (dash-dot lines, at this point, the 74Se abundance is about zero, hence not visible on the plot), at the end of the hydrostatic post-processing calculation (dashed lines) and after the supernova explosion (solid lines).
Current usage metrics show cumulative count of Article Views (full-text article views including HTML views, PDF and ePub downloads, according to the available data) and Abstracts Views on Vision4Press platform.
Data correspond to usage on the plateform after 2015. The current usage metrics is available 48-96 hours after online publication and is updated daily on week days.
Initial download of the metrics may take a while.