Fig. 5.
Download original image
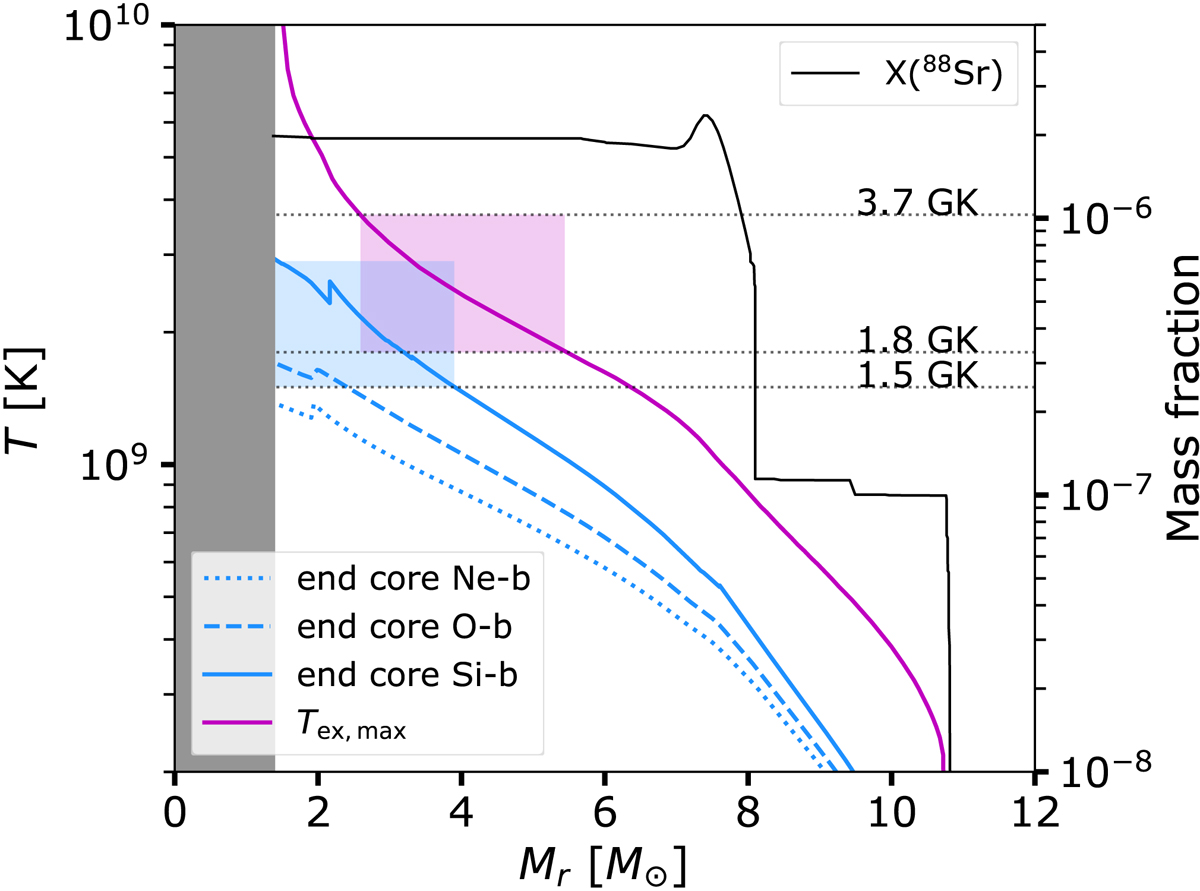
Temperature profiles at different stages of the evolution (blue lines) and maximum temperature reached during the explosion (magenta line) for the M25Zm3V4 model. The abundance profile of the s-nuclide 88Sr is shown in black with the scale on the right. The blue and magenta rectangle show where the p-process can take place (in terms of temperature range and mass coordinate range) during the hydrostatic and explosive burning, respectively (see text for details). The dark grey area shows the extent of the remnant (corresponding to the size of the 56Ni core; cf. Sect. 2.2). The three horizontal dashed lines correspond to temperatures of 1.5, 1.8, and 3.7 GK.
Current usage metrics show cumulative count of Article Views (full-text article views including HTML views, PDF and ePub downloads, according to the available data) and Abstracts Views on Vision4Press platform.
Data correspond to usage on the plateform after 2015. The current usage metrics is available 48-96 hours after online publication and is updated daily on week days.
Initial download of the metrics may take a while.