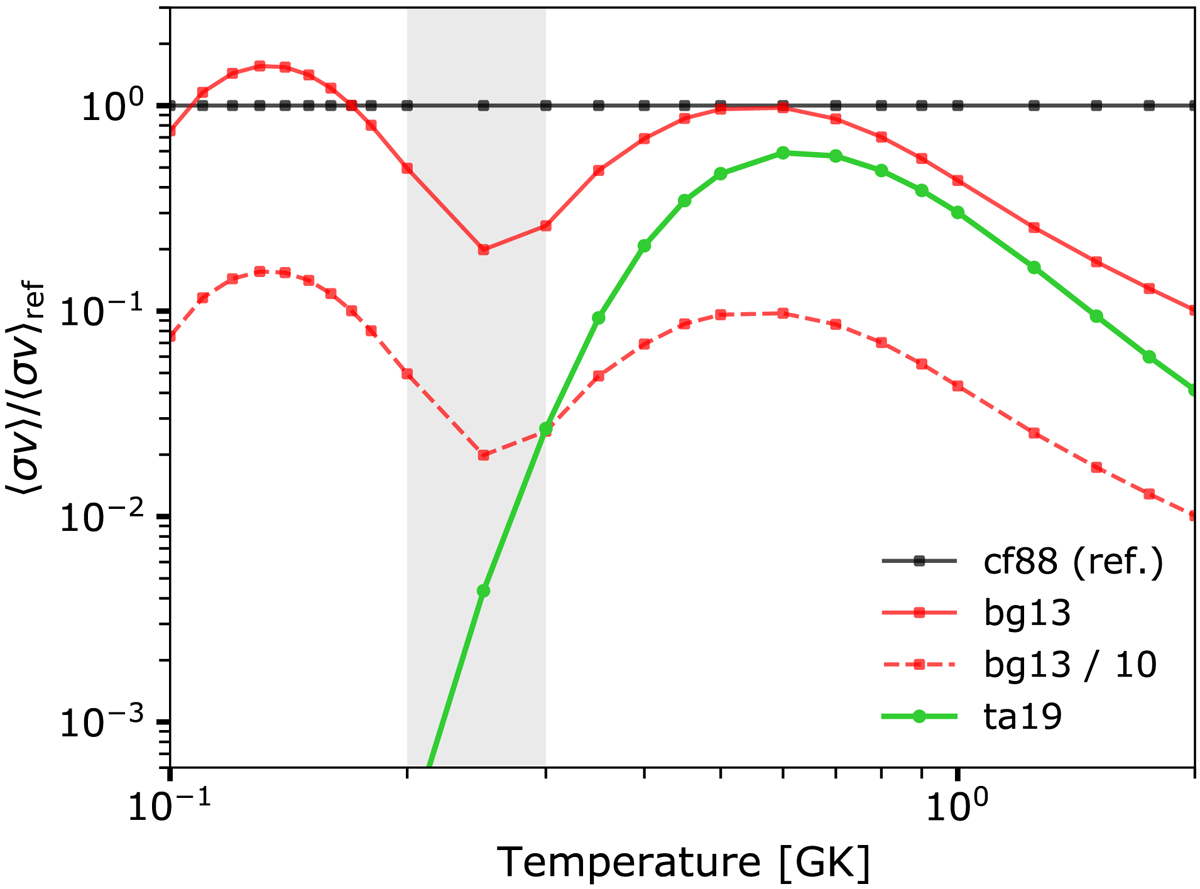
Fig. 2.
Download original image
Ratio of 17O(α,γ)21Ne reaction rates to the rate of Caughlan & Fowler (1988, cf88 label). The red curve (label bg13) is the recommended rate of Best et al. (2013). The green curve (label ta19) is the experimental lower limit from Taggart et al. (2019). The shaded area indicates the approximate range of temperatures in the helium-burning core of massive stars.
Current usage metrics show cumulative count of Article Views (full-text article views including HTML views, PDF and ePub downloads, according to the available data) and Abstracts Views on Vision4Press platform.
Data correspond to usage on the plateform after 2015. The current usage metrics is available 48-96 hours after online publication and is updated daily on week days.
Initial download of the metrics may take a while.