Fig. 1.
Download original image
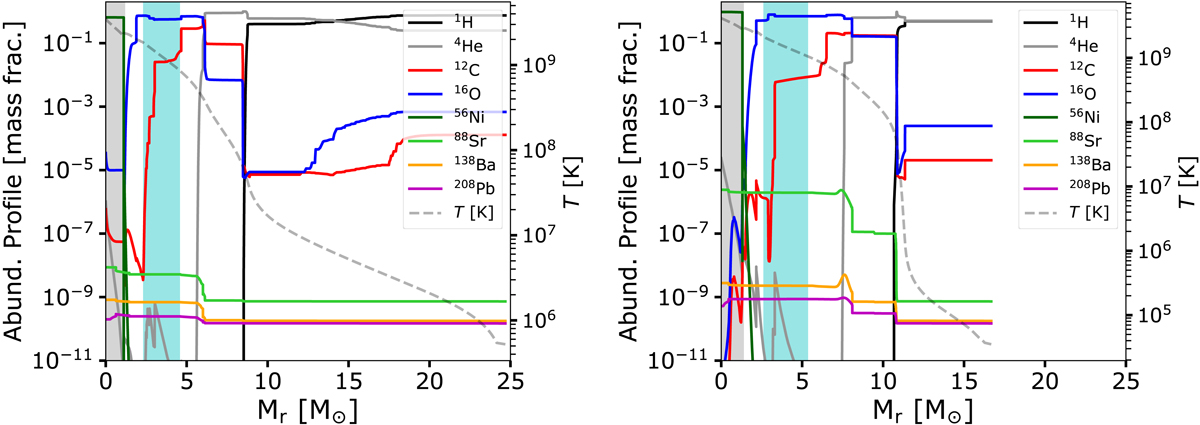
Pre-supernova abundance profiles for the M25Zm3V0 (non-rotating, left panel) and M25Zm3V4 (rotating, υini/υcrit = 0.4, right panel) models computed with the rate of 17O(α,γ)21Ne from Best et al. (2013). The abundances of trans-iron elements are not explicitly followed from core O-burning ignition (see text for details). The dashed grey line shows the pre-supernova temperature profile, the scale of which is indicated on the right axis. The shaded grey area represents the remnant. The cyan area represents the zone in which the maximum temperature during a spherical 1051 erg explosion ranges between 1.8 and 3.7 GK (i.e. the zone in which the explosive p-process takes place).
Current usage metrics show cumulative count of Article Views (full-text article views including HTML views, PDF and ePub downloads, according to the available data) and Abstracts Views on Vision4Press platform.
Data correspond to usage on the plateform after 2015. The current usage metrics is available 48-96 hours after online publication and is updated daily on week days.
Initial download of the metrics may take a while.