Open Access
Fig. A.3.
Download original image
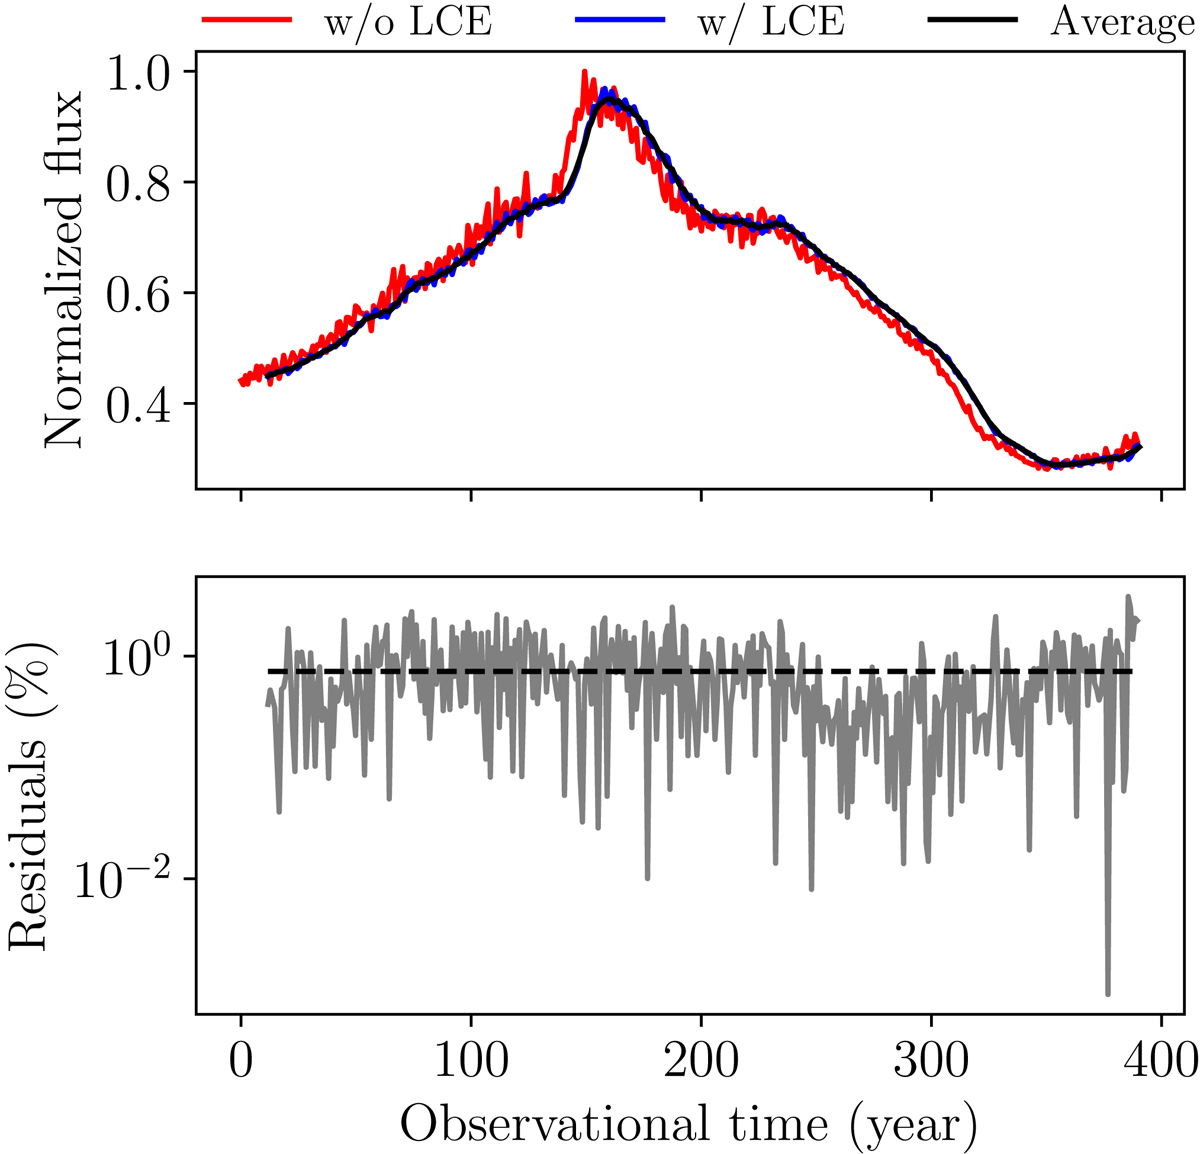
Light curves with (blue) and without (red) the LCE for 1018 Hz at θobs = 90°. The dark line represents the “moving average method”. The gray line in the lower panel shows the residuals between both methods (light curves with the LCE minus the moving average over the light curve with the LCE).
Current usage metrics show cumulative count of Article Views (full-text article views including HTML views, PDF and ePub downloads, according to the available data) and Abstracts Views on Vision4Press platform.
Data correspond to usage on the plateform after 2015. The current usage metrics is available 48-96 hours after online publication and is updated daily on week days.
Initial download of the metrics may take a while.