Fig. 3.
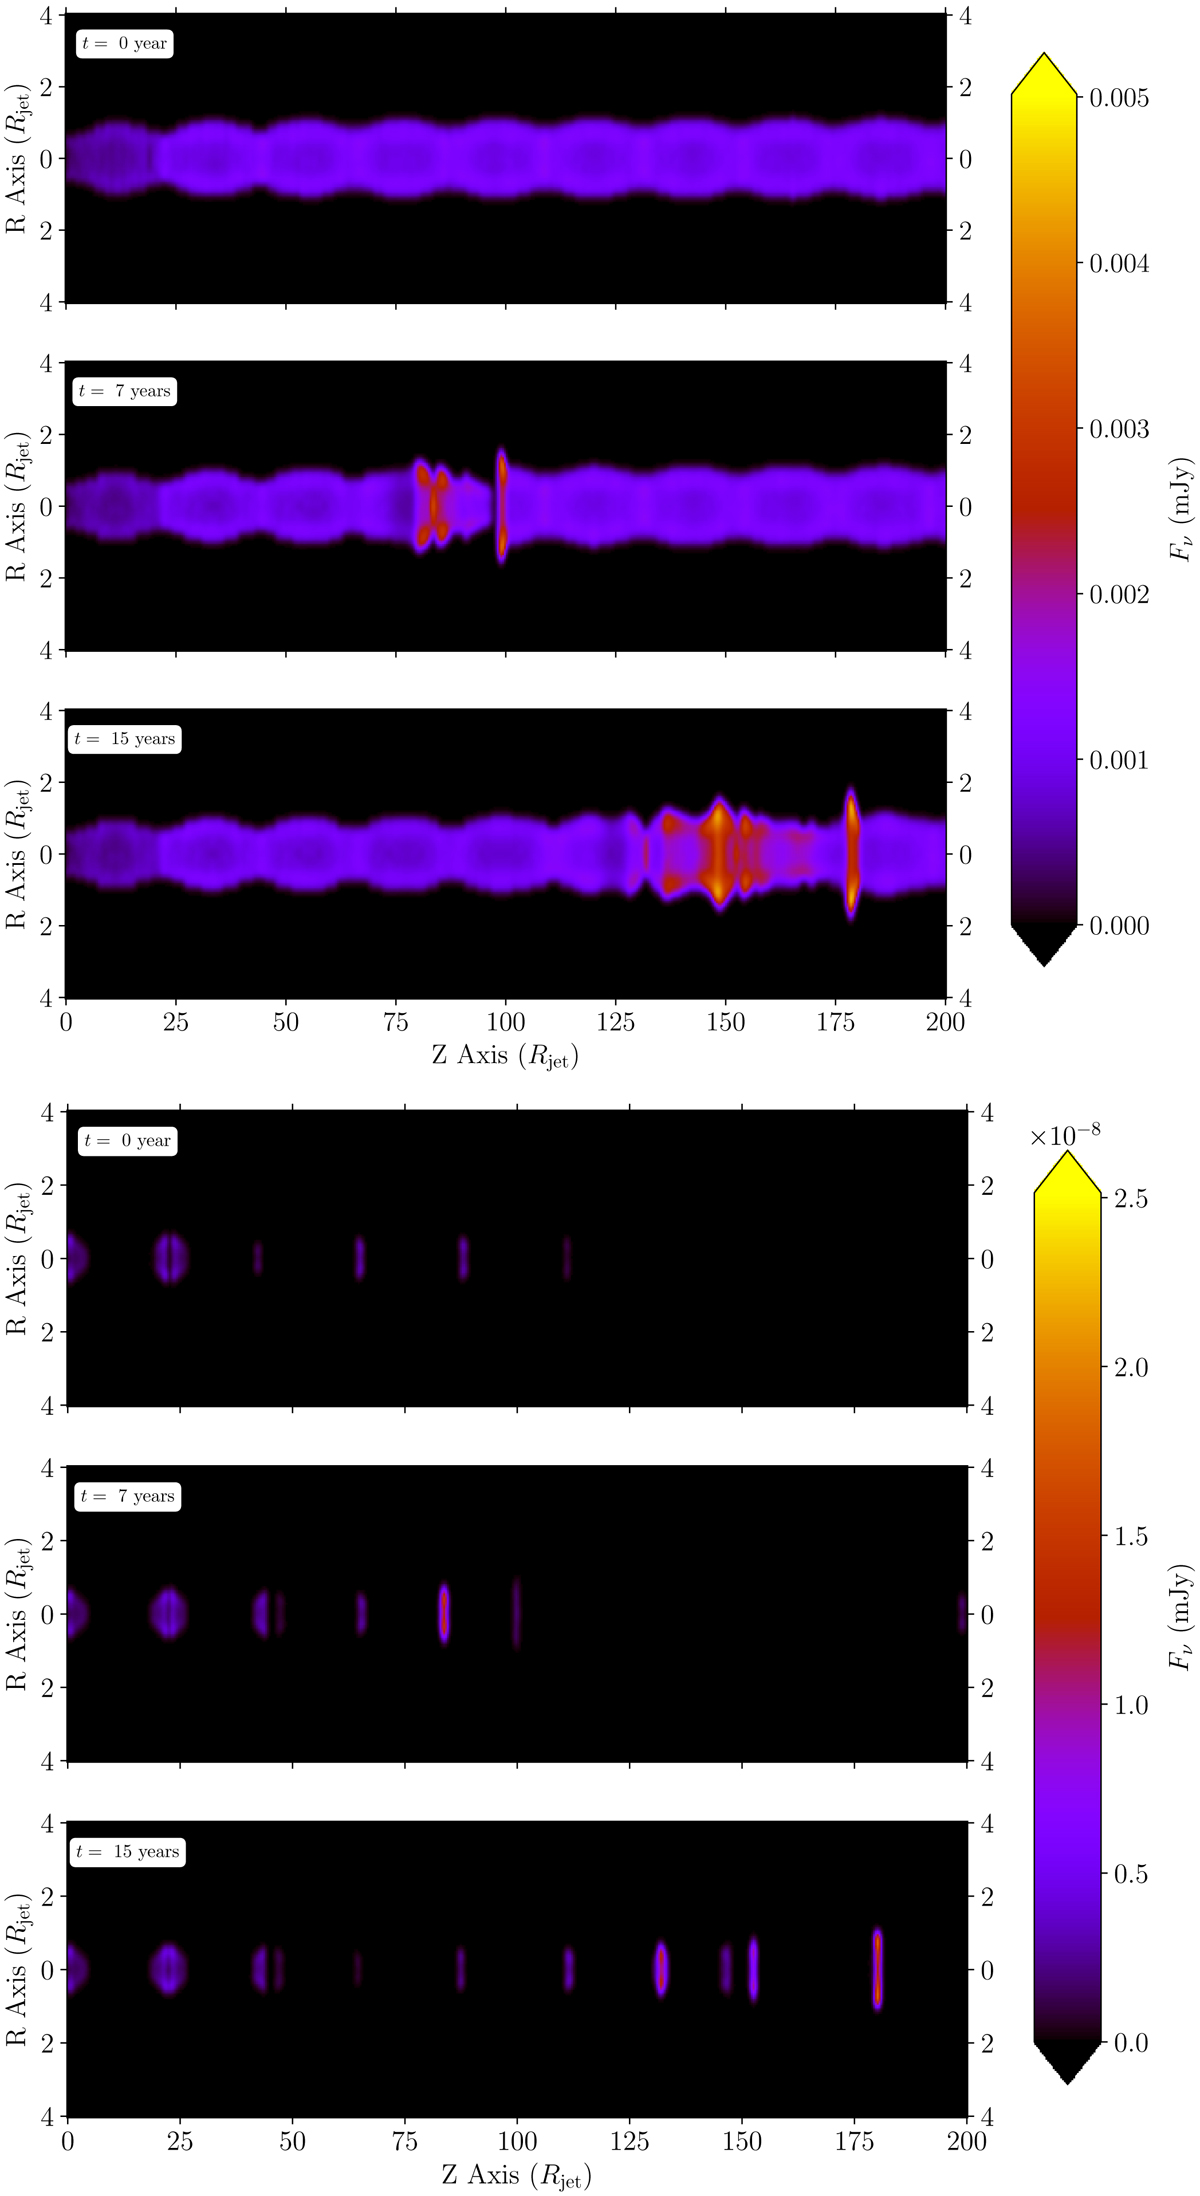
Download original image
Snapshots of the synchrotron emission maps of the jet before and after introduction of the ejecta, seen at two frequencies, ν = 1010 Hz (top) and ν = 1018 Hz (bottom). Each map represents the flux intensity in mJy units. The R and the Z axes are given in Rjet units. These maps represent the flux in the comoving frame for a viewing angle of θobs = 90° at three different comoving times (see the white boxes). The flux is evaluated at the distance of the radio galaxy 3C 111.
Current usage metrics show cumulative count of Article Views (full-text article views including HTML views, PDF and ePub downloads, according to the available data) and Abstracts Views on Vision4Press platform.
Data correspond to usage on the plateform after 2015. The current usage metrics is available 48-96 hours after online publication and is updated daily on week days.
Initial download of the metrics may take a while.