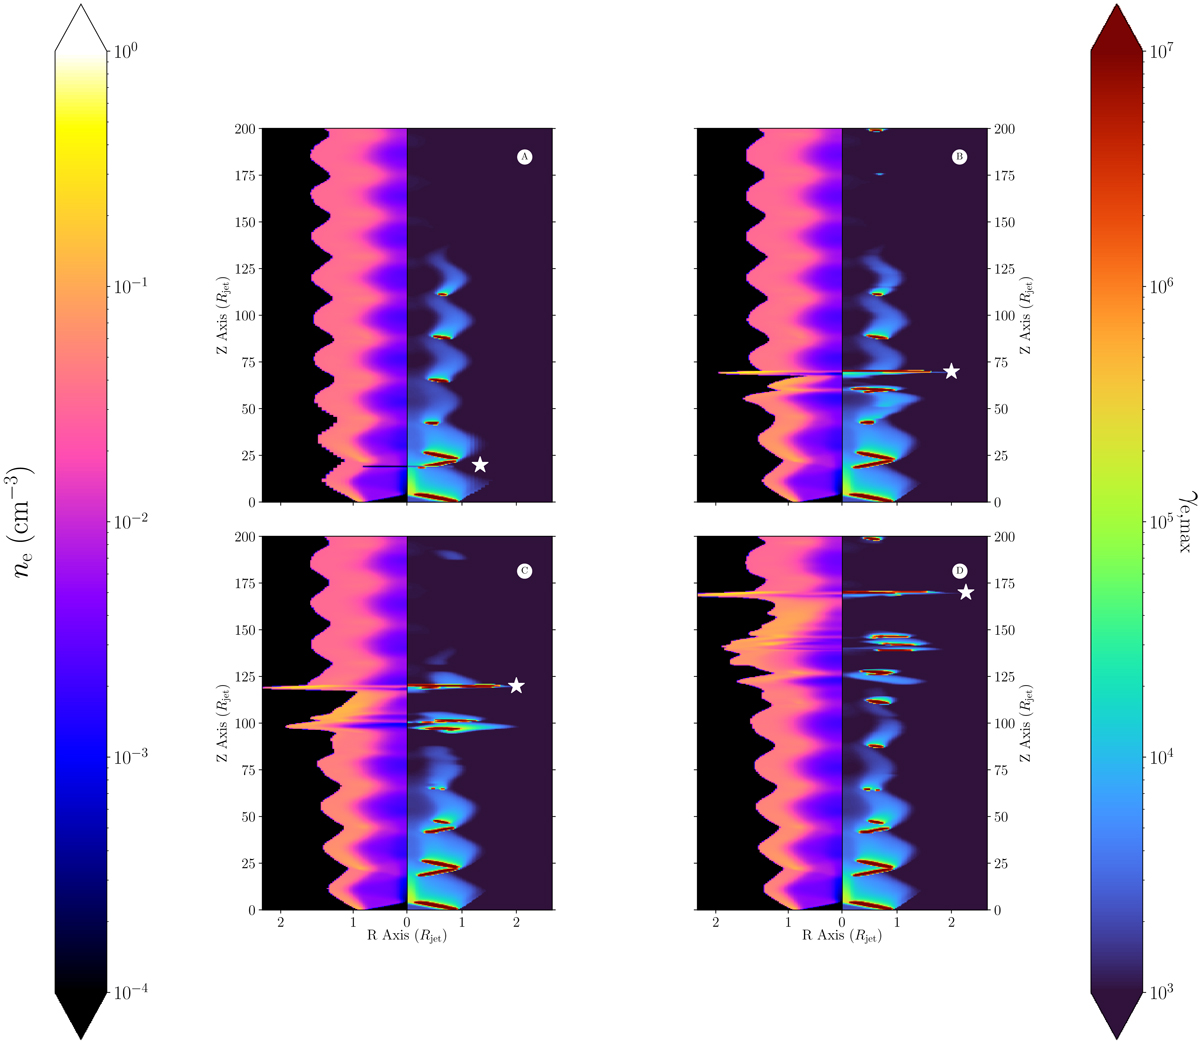
Fig. 1.

Download original image
Snapshots of the jet with an injected perturbation. The jet is propagating from the bottom to the top along the Z axis. The electron number density contour (in log-scale) is drawn on the left side, and the maximum value of the electron Lorentz factor (also in log-scale) on the right side. Both radial coordinates R and Z are given in Rjet units. The generated moving shock wave is located at ∼20 Rjet (A), ∼70 Rjet (B), ∼120 Rjet (C), and ∼170 Rjet (D) from the jet base and is marked with a white star.
Current usage metrics show cumulative count of Article Views (full-text article views including HTML views, PDF and ePub downloads, according to the available data) and Abstracts Views on Vision4Press platform.
Data correspond to usage on the plateform after 2015. The current usage metrics is available 48-96 hours after online publication and is updated daily on week days.
Initial download of the metrics may take a while.


