Free Access
Fig. 2
Download original image
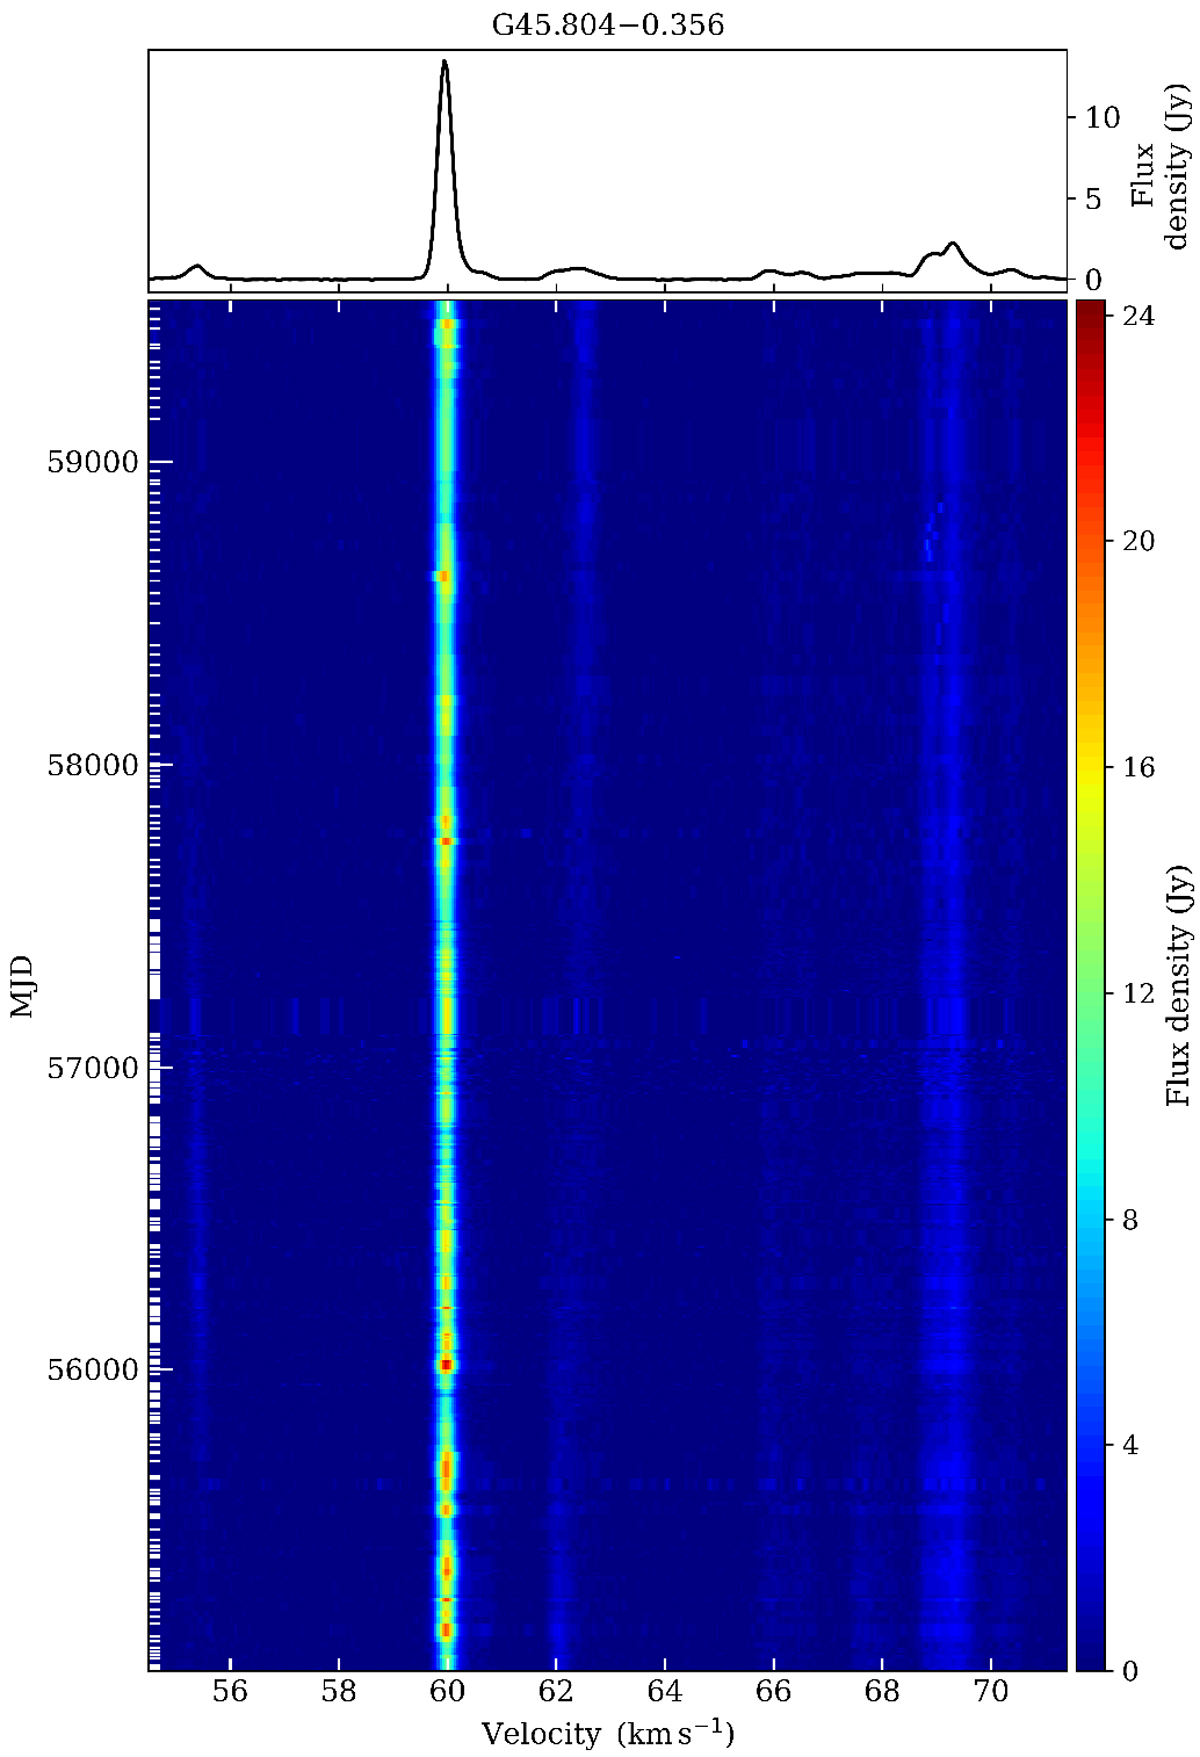
Dynamic spectrum of G45.804−0.356. The velocity scale is relative to the local standard of rest. The horizontal bars in the left coordinate correspond to the dates of the observed spectra. The top panel shows the average spectrum from the whole observation period.
Current usage metrics show cumulative count of Article Views (full-text article views including HTML views, PDF and ePub downloads, according to the available data) and Abstracts Views on Vision4Press platform.
Data correspond to usage on the plateform after 2015. The current usage metrics is available 48-96 hours after online publication and is updated daily on week days.
Initial download of the metrics may take a while.