Fig. 1

Download original image
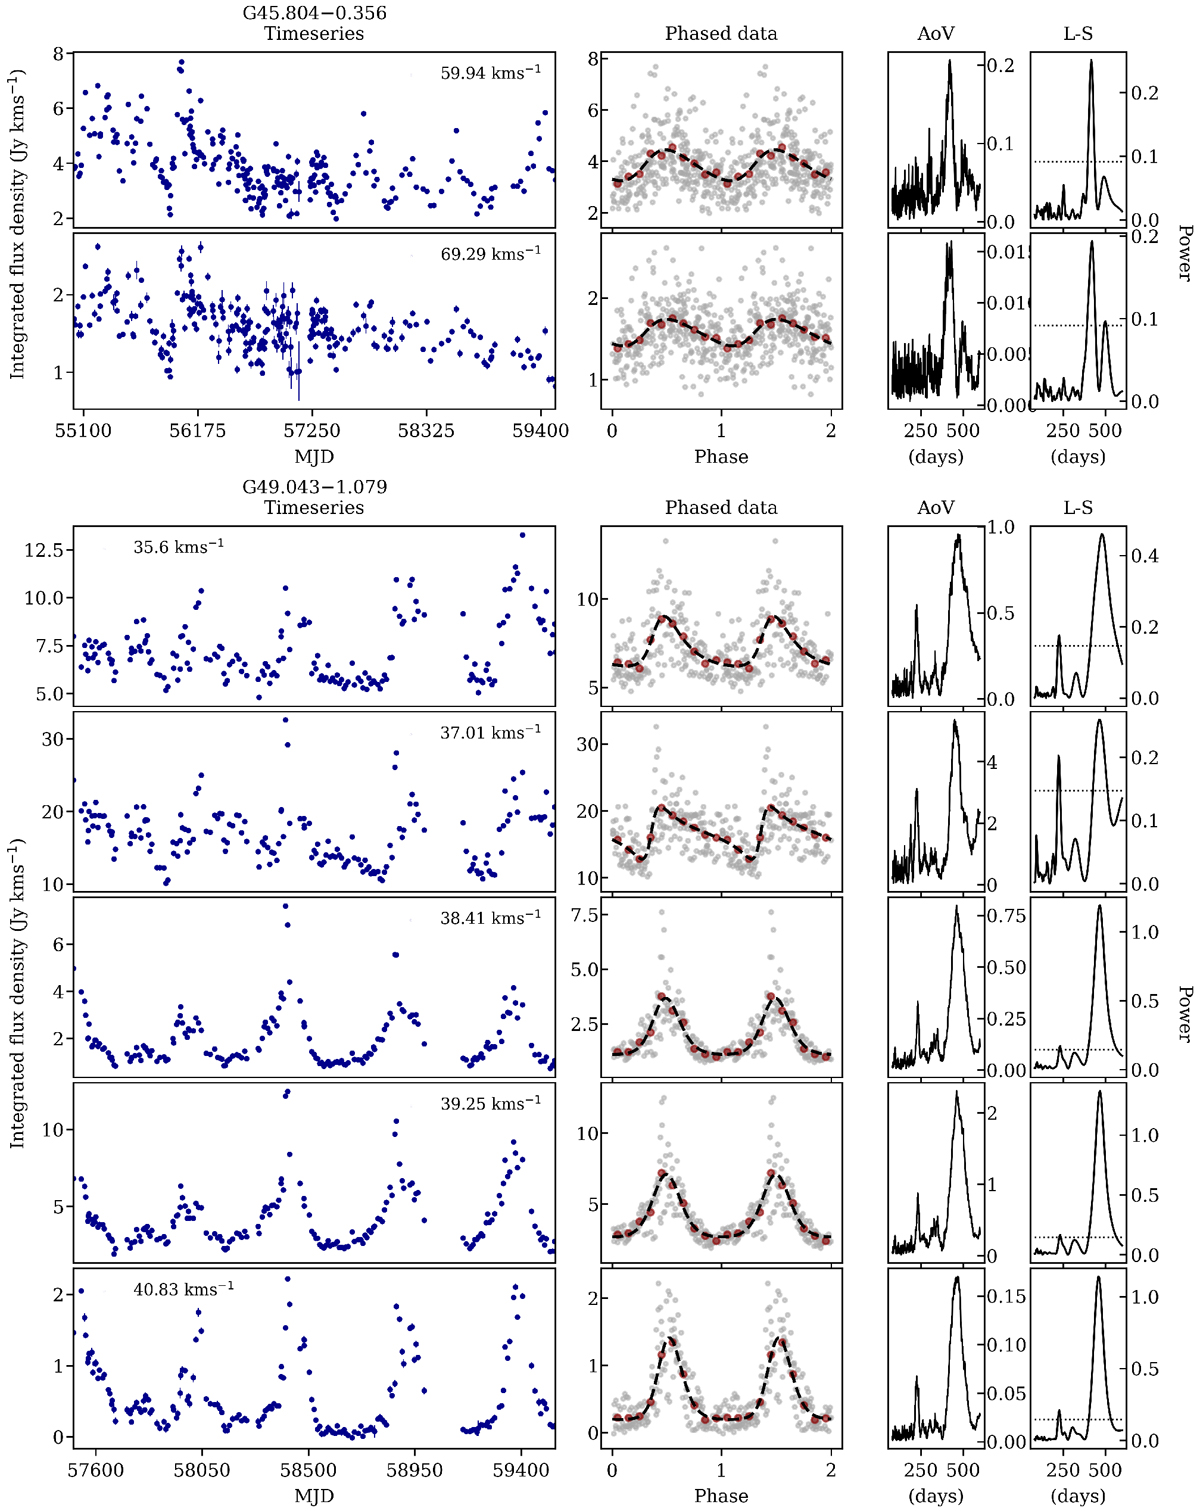
Periodic behaviour of both 6.7 GHz sources. Panels in the leftmost column show the time series of spectral features. In the second column, grey points represent time series phased to the calculated period, red points show data binned with 0.1 phase intervals, and dashed black lines show the fitted asymmetric periodic power function. The third and fourth columns respectively show AoV and L−S periodograms. The dotted line in the last column represents the 1% false alarm probability level.
Current usage metrics show cumulative count of Article Views (full-text article views including HTML views, PDF and ePub downloads, according to the available data) and Abstracts Views on Vision4Press platform.
Data correspond to usage on the plateform after 2015. The current usage metrics is available 48-96 hours after online publication and is updated daily on week days.
Initial download of the metrics may take a while.


