Fig. 2
Download original image
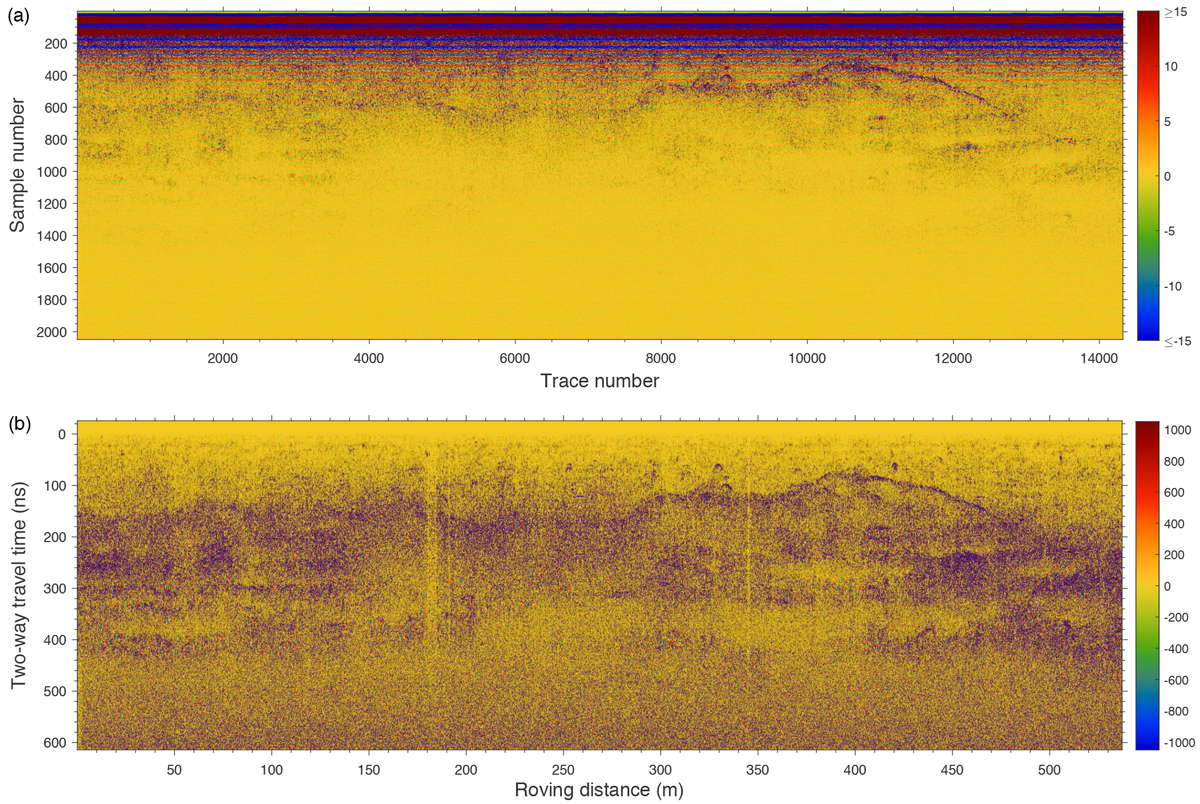
(a) Raw data obtained by CE-4 LPR second channel (500 MHz) from January 2019 to September 2020. The sampling interval is 0.3125 ns and the average trace interval is 3.75 cm. The colors represent relative electric field strength of echoes received by antenna. The radargram is shown in a dynamic range of –15 to 15 to reveal more details in deeper regolith. (b) LPR data after bandpass filtering, background removal, time-zero correction, and spherical exponential compensation.
Current usage metrics show cumulative count of Article Views (full-text article views including HTML views, PDF and ePub downloads, according to the available data) and Abstracts Views on Vision4Press platform.
Data correspond to usage on the plateform after 2015. The current usage metrics is available 48-96 hours after online publication and is updated daily on week days.
Initial download of the metrics may take a while.