Fig. 6
Download original image
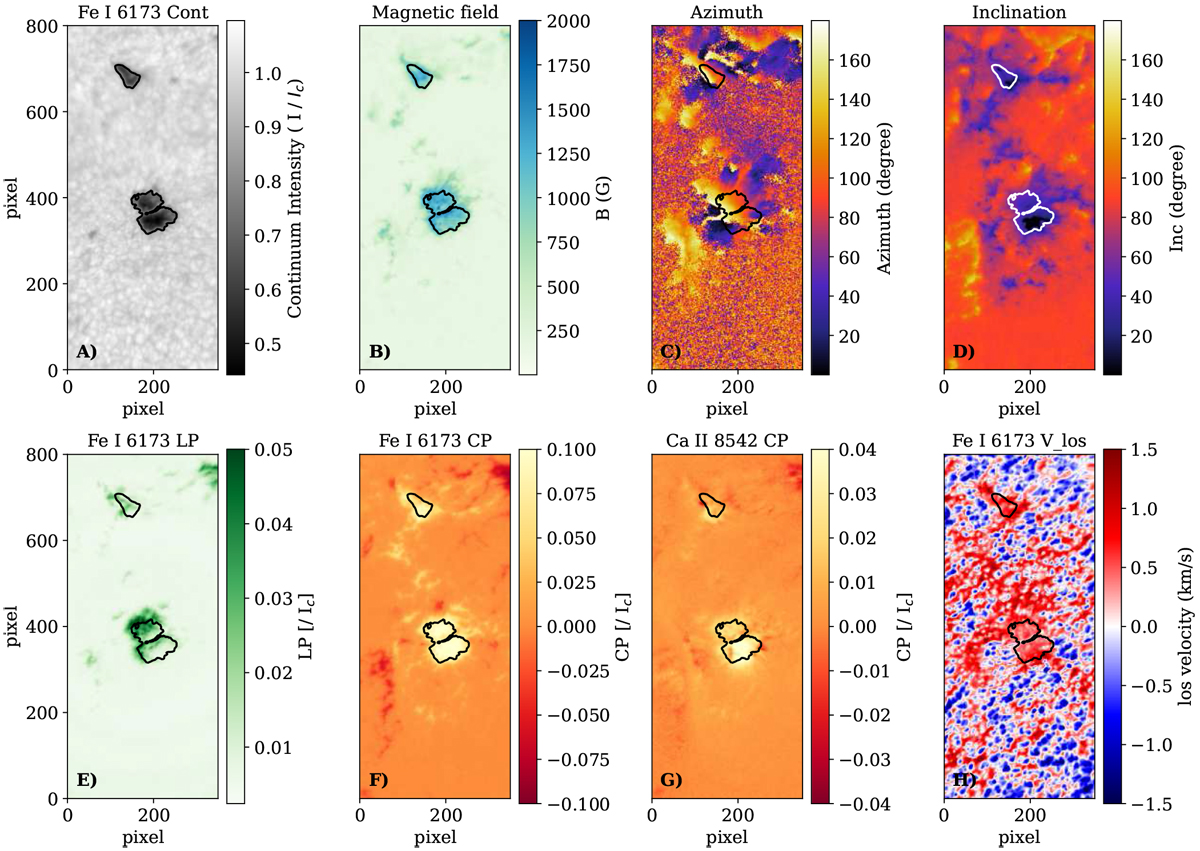
Examples of Level 1, Level 1.5, and Level 2 data available in IBIS-A for the flaring region with magnetic pores shown in Fig. 5. The observations were taken on 13 May 2016 at 15:00 UT. The top panels show Level 1 (panel A) and Level 2 (panels B–D) data, while the bottom panels show Level 1.5 (panels E–H) data. Top panels, from left to right: maps of the intensity measured on the FOV at the Fe 16173 Å line continuum and of the magnetic field strength, azimuth, and inclination angles derived from the VFISV inversion of the Fe I 6173 Å line data. Bottom panels, from left to right: maps of the linear and circular polarization estimated from the photospheric Fe I 6173 Å line data, circular polarization from the chromospheric Ca II 8542 Å observations, and los velocity field at photopheric heights from Fe I 6173 Å measurements (see Fig. 5 for more details).
Current usage metrics show cumulative count of Article Views (full-text article views including HTML views, PDF and ePub downloads, according to the available data) and Abstracts Views on Vision4Press platform.
Data correspond to usage on the plateform after 2015. The current usage metrics is available 48-96 hours after online publication and is updated daily on week days.
Initial download of the metrics may take a while.