Fig. 5
Download original image
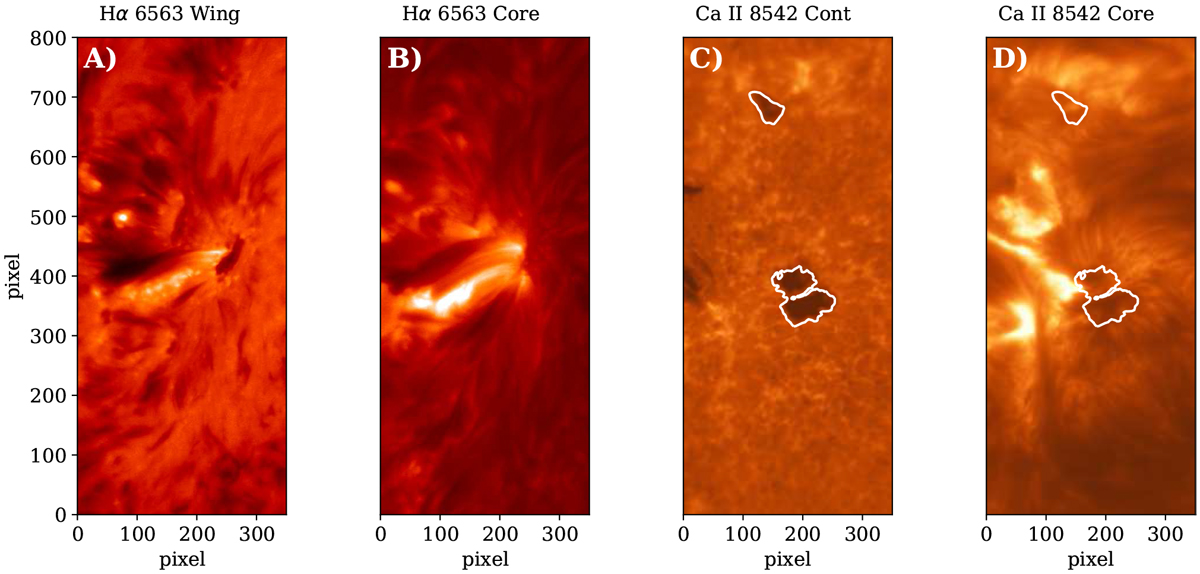
Examples of Level 1 data of chromospheric flaring regions available in IBIS-A. The data were acquired along the Hα 6563 Å line, in the wing (panel A) and core (panel B) of the line, on 10 October 2014, 14:20 UT at disk position μ = 0.43, and along the Ca II 8542 Å line, in the far wing (panel C) and line core (panel D), on 13 May 2016, 15:00 UT, at disk position μ = 0.9. The white lines in the rightmost panels show contours of the magnetic pore regions corresponding to Ic(x, y) = 0.8 × Ic (quiet), where Ic(x, y) and Ic (quiet) are values of the line continuum intensity at the given position (x, y) and in the quiet region.
Current usage metrics show cumulative count of Article Views (full-text article views including HTML views, PDF and ePub downloads, according to the available data) and Abstracts Views on Vision4Press platform.
Data correspond to usage on the plateform after 2015. The current usage metrics is available 48-96 hours after online publication and is updated daily on week days.
Initial download of the metrics may take a while.