Fig. 3
Download original image
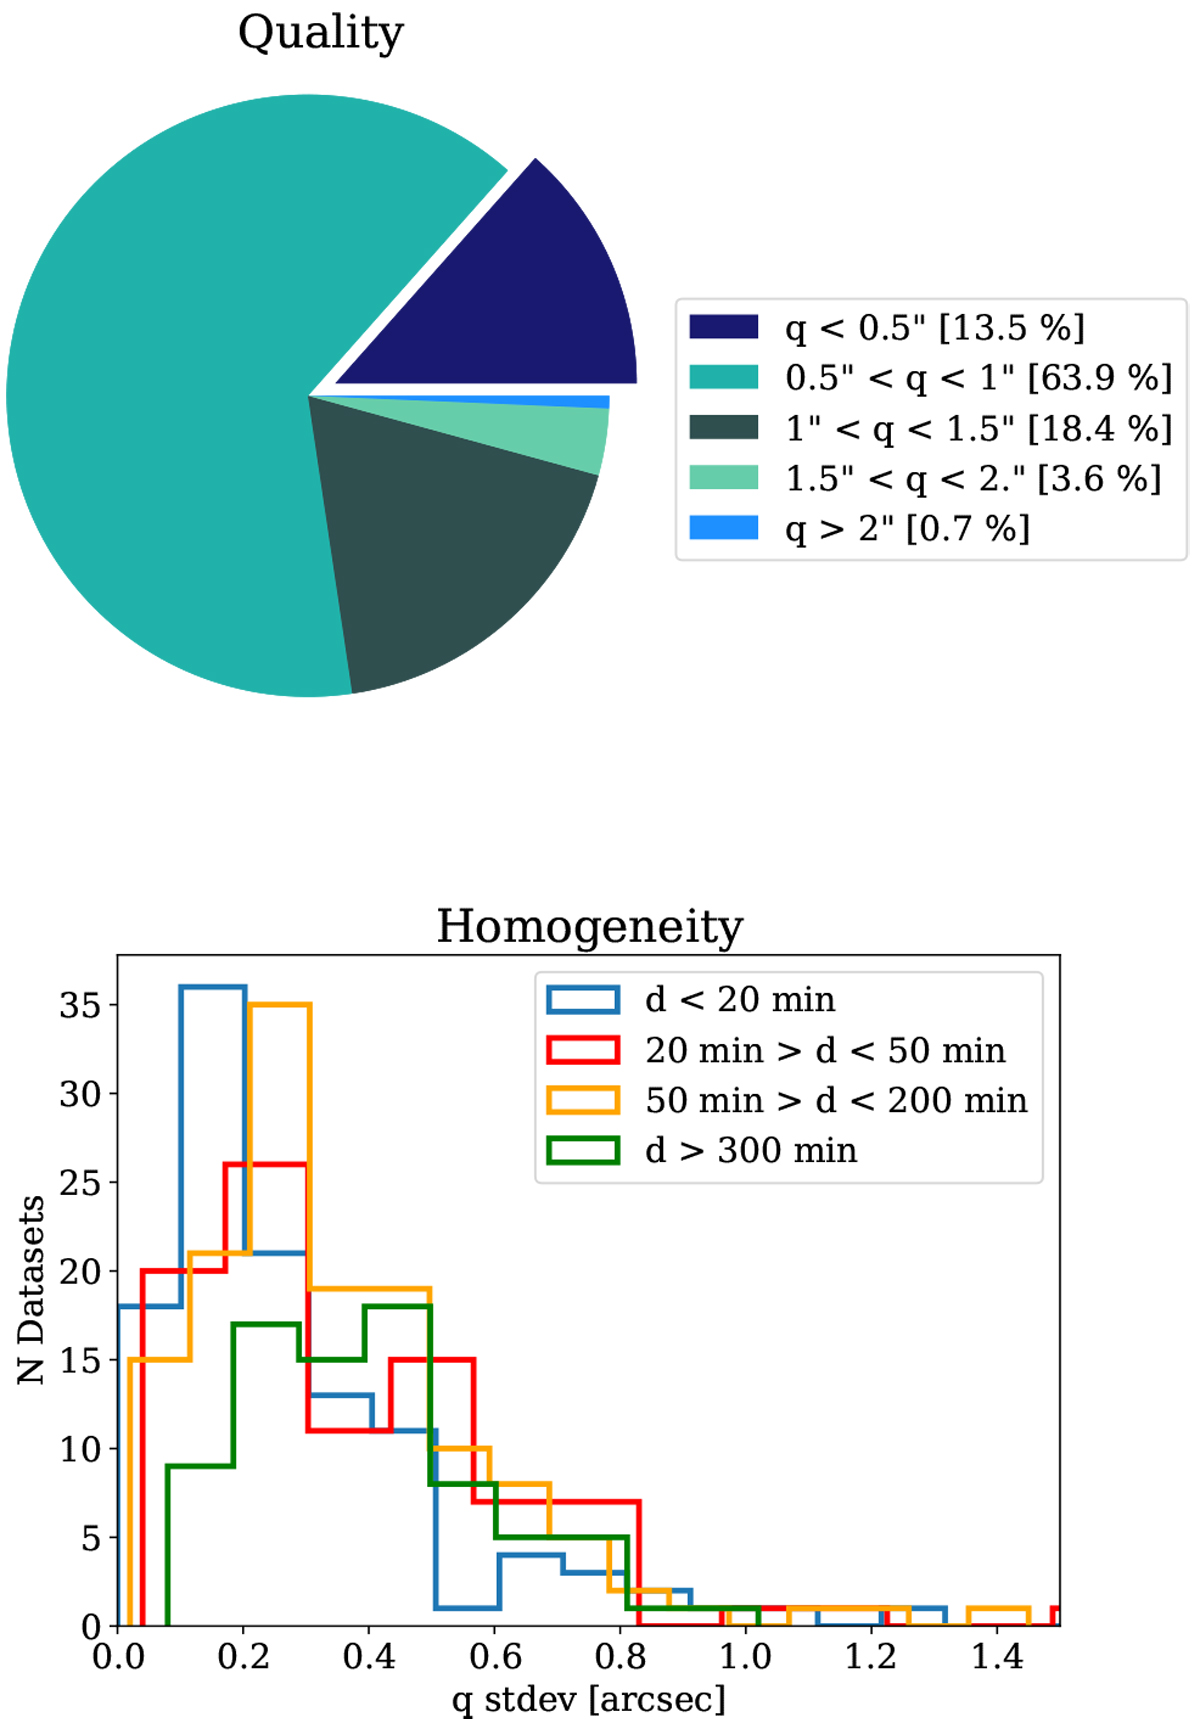
Quality and homogeneity of the Level 0 data stored in the archive. Top panel: pie chart of the IBIS-A data divided for the median value of the quality image parameter q (in arcsec) during acquisition of Level 0 data (see Sect. 3.1 for details). Bottom panel: number of Level 0 datasets depending on their duration d and homogeneity of the quality image parameter q during observations. The homogeneity of the dataset is described by the standard deviation of the q values measured during the observing run.
Current usage metrics show cumulative count of Article Views (full-text article views including HTML views, PDF and ePub downloads, according to the available data) and Abstracts Views on Vision4Press platform.
Data correspond to usage on the plateform after 2015. The current usage metrics is available 48-96 hours after online publication and is updated daily on week days.
Initial download of the metrics may take a while.