Fig. 2
Download original image
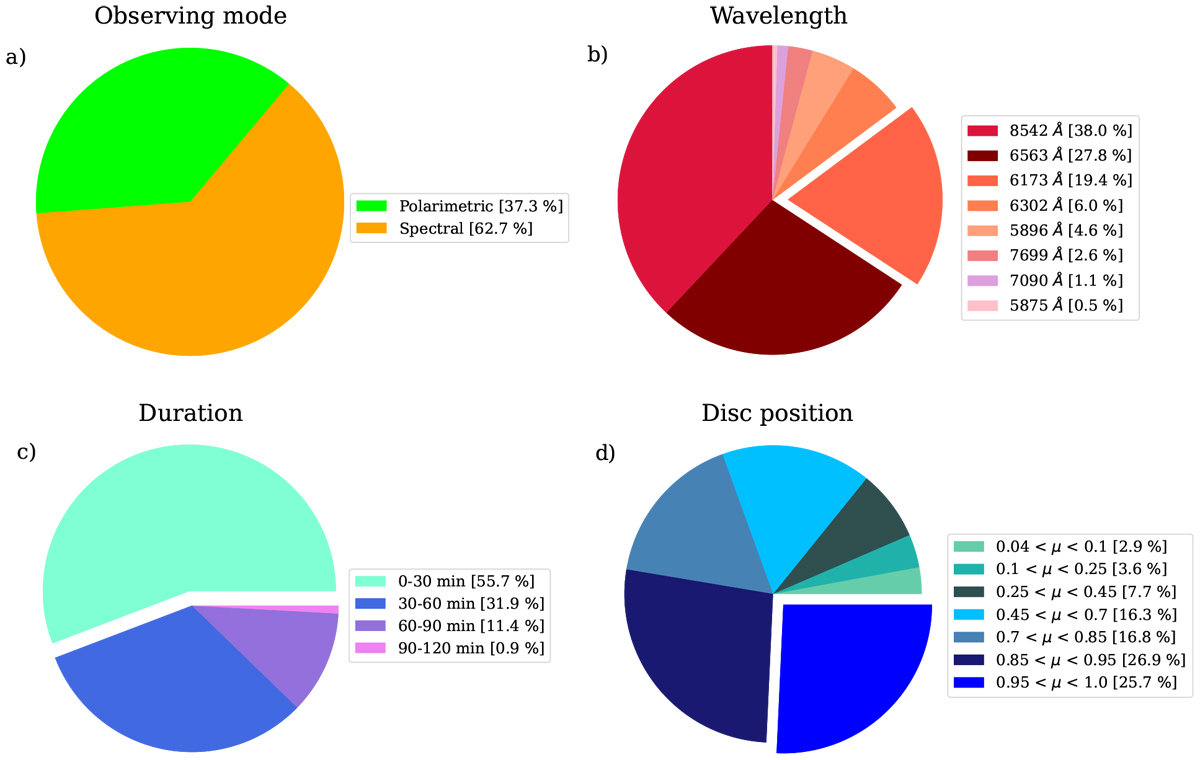
Level 0 data stored in the archive. Shown are pie charts of the fraction (in %) of panel a) the spectroscopic and spectropolarimetric data available in IBIS-A, panel b) the spectral lines (in Å) acquired during the observations, panel c) the duration (in minutes) of the observational sequences, and panel d) the μ disk position of the FOV (μ = cosθ where θ is the heliocentric angle).
Current usage metrics show cumulative count of Article Views (full-text article views including HTML views, PDF and ePub downloads, according to the available data) and Abstracts Views on Vision4Press platform.
Data correspond to usage on the plateform after 2015. The current usage metrics is available 48-96 hours after online publication and is updated daily on week days.
Initial download of the metrics may take a while.