Fig. 3.
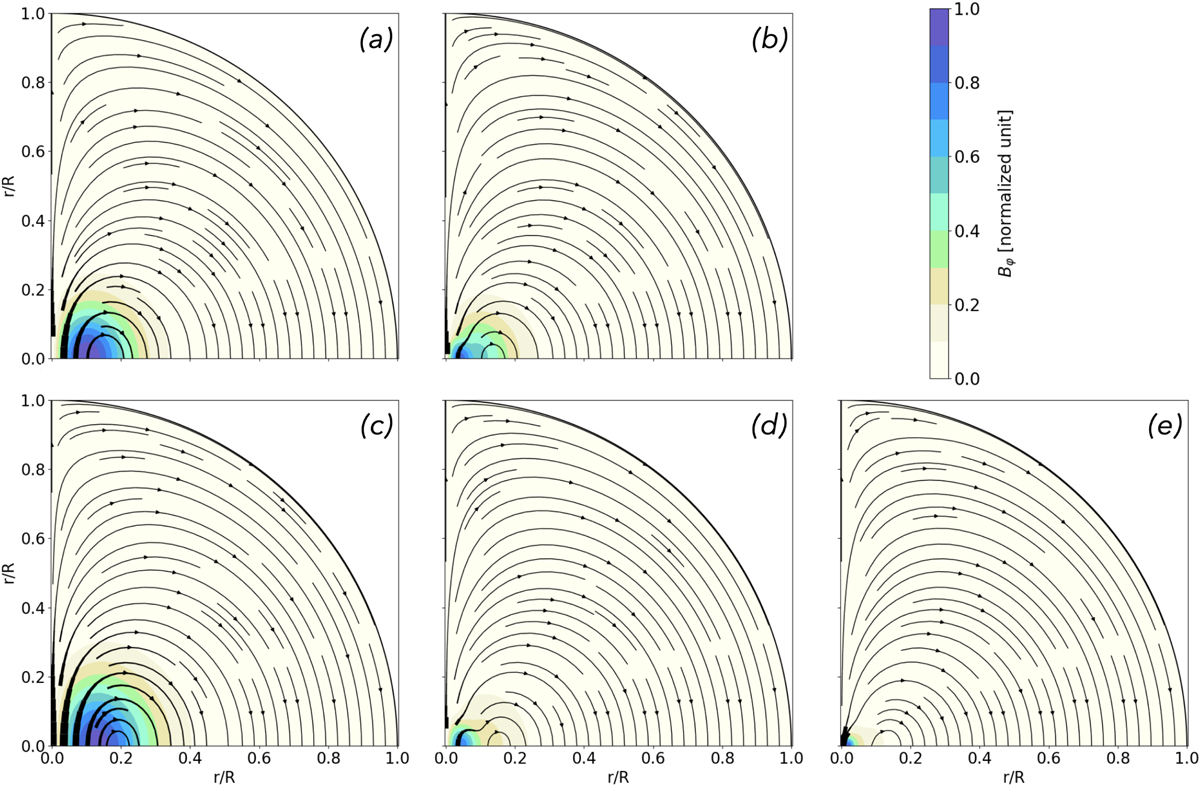
Download original image
Magnetic field configurations: inside the 1.6 M⊙γ Dor star near ZAMS (a), at mid-MS (b), inside the 5 M⊙ SPB near ZAMS (c), at mid-MS (d), and near TAMS (e). Values are normalised by the maximum field amplitude, and mixed poloidal (black lines) and toroidal (colour scale) magnetic fields are modelled using the formalism of Duez & Mathis (2010) (see our Eq. (59)). We focus here on the effects of the toroidal component as discussed in the text.
Current usage metrics show cumulative count of Article Views (full-text article views including HTML views, PDF and ePub downloads, according to the available data) and Abstracts Views on Vision4Press platform.
Data correspond to usage on the plateform after 2015. The current usage metrics is available 48-96 hours after online publication and is updated daily on week days.
Initial download of the metrics may take a while.