Fig. 2.
Download original image
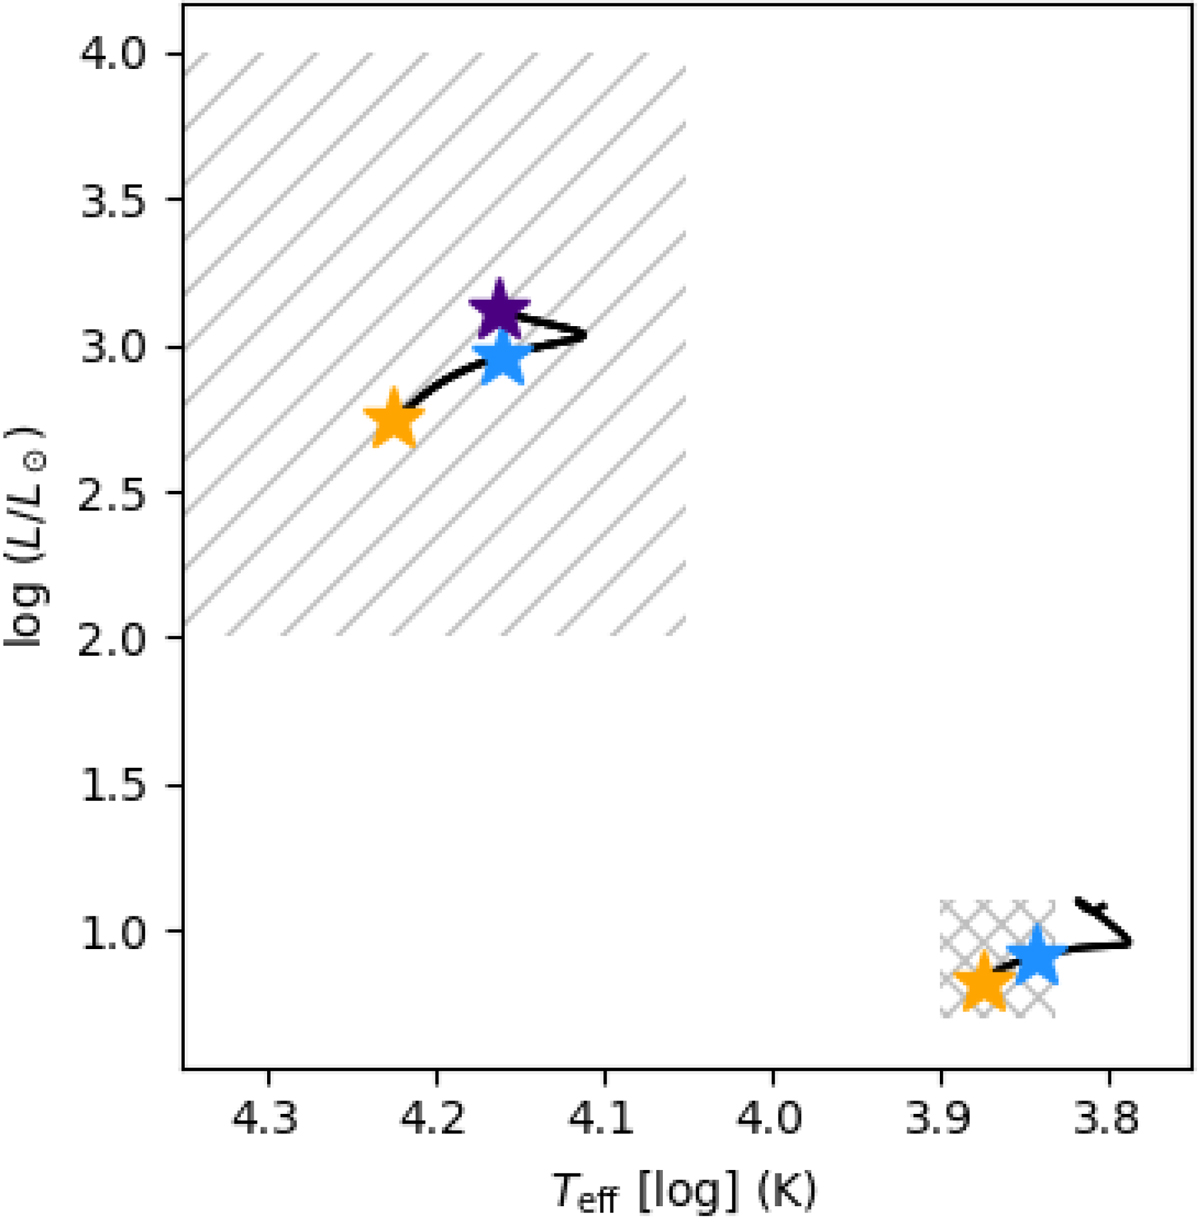
Main-sequence tracks of a M = 1.6 M⊙γ Dor star and a M = 5 M⊙ SPB star in the Hertzsprung–Russell diagram. The crossed (respectively hatched) area roughly indicates the region where γ Dor (respectively SPB) stars are expected to host gravity modes (Aerts et al. 2010, Appendix A). Yellow, blue, and purple stars indicate the chosen models at ZAMS, mid-MS, and TAMS, respectively.
Current usage metrics show cumulative count of Article Views (full-text article views including HTML views, PDF and ePub downloads, according to the available data) and Abstracts Views on Vision4Press platform.
Data correspond to usage on the plateform after 2015. The current usage metrics is available 48-96 hours after online publication and is updated daily on week days.
Initial download of the metrics may take a while.