Free Access
Fig. A.1.
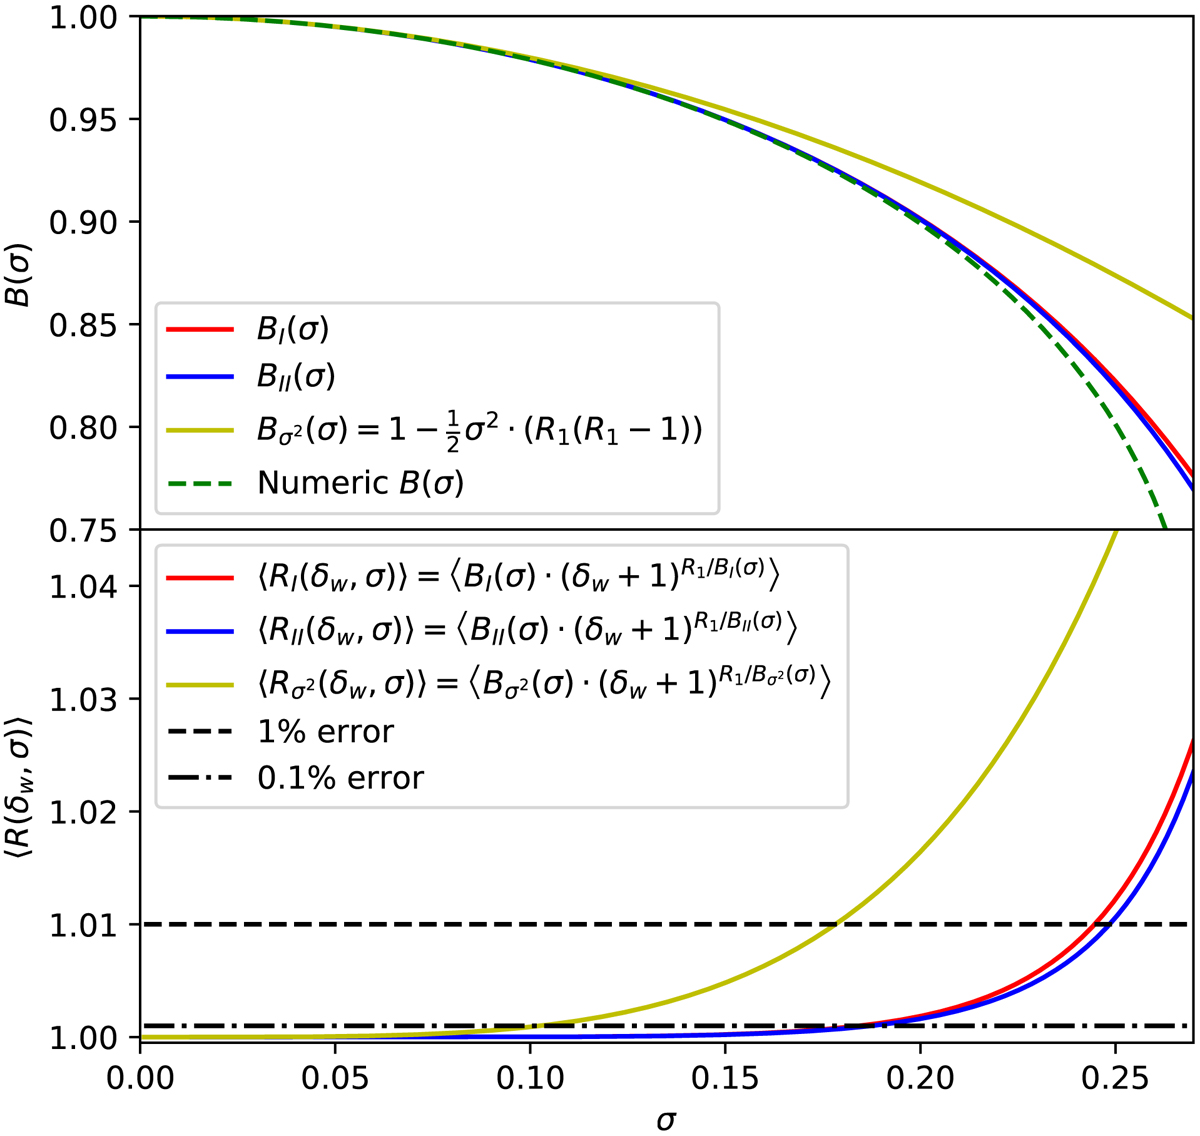
Download original image
Approximate super survey biases. Top: Approximate BI(σ) and BII(σ) solutions with the numeric B(σ) function. Bottom: Error in the average of the RI(δw, σ) and RII(δw, σ) responses generated from the BI(σ) and BII(σ) functions, respectively. We have adopted R1 = 47/21 + 1/3 for this plot.
Current usage metrics show cumulative count of Article Views (full-text article views including HTML views, PDF and ePub downloads, according to the available data) and Abstracts Views on Vision4Press platform.
Data correspond to usage on the plateform after 2015. The current usage metrics is available 48-96 hours after online publication and is updated daily on week days.
Initial download of the metrics may take a while.