Free Access
Fig. 2.
Download original image
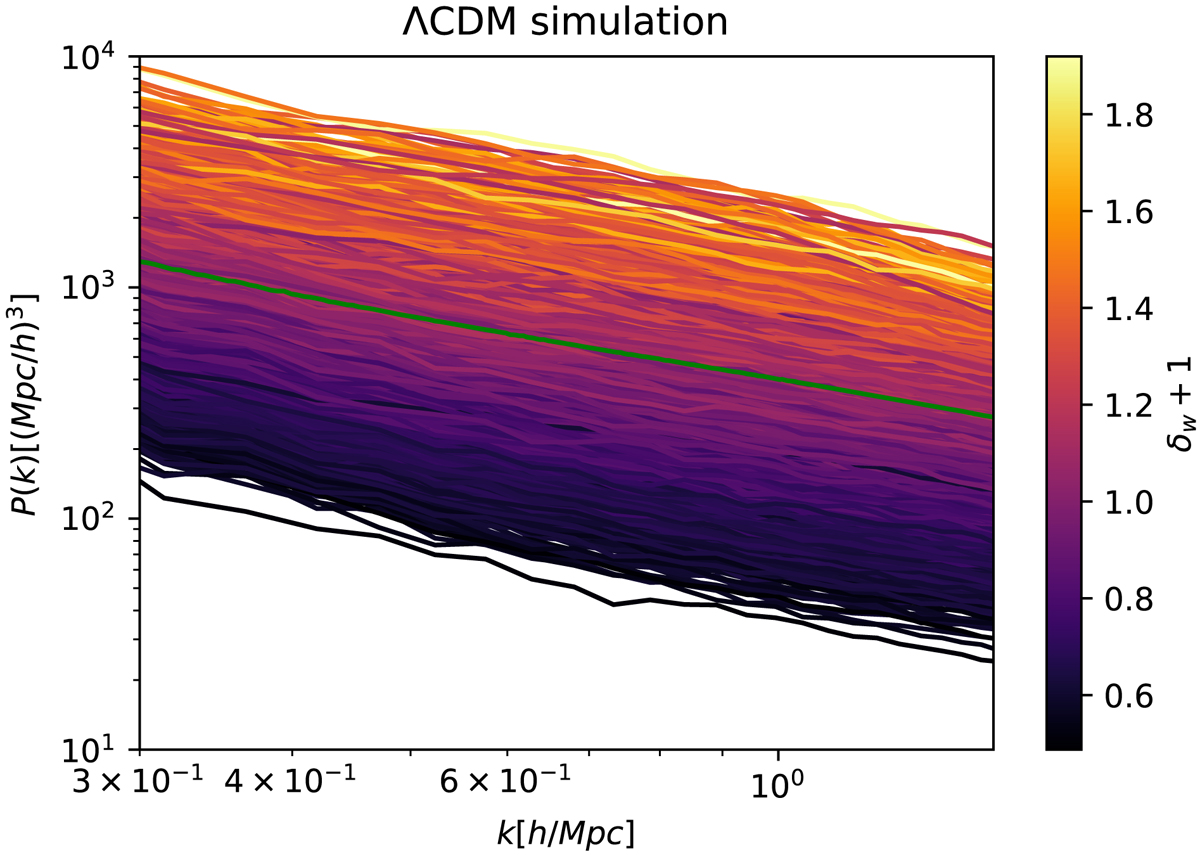
Position-dependent power spectra in our ΛCDM simulation at z = 0 with a L = 60 Mpc h−1 window size. The color represents the average density of each sub-volume. The full-volume power spectrum is plotted as a green curve for reference.
Current usage metrics show cumulative count of Article Views (full-text article views including HTML views, PDF and ePub downloads, according to the available data) and Abstracts Views on Vision4Press platform.
Data correspond to usage on the plateform after 2015. The current usage metrics is available 48-96 hours after online publication and is updated daily on week days.
Initial download of the metrics may take a while.