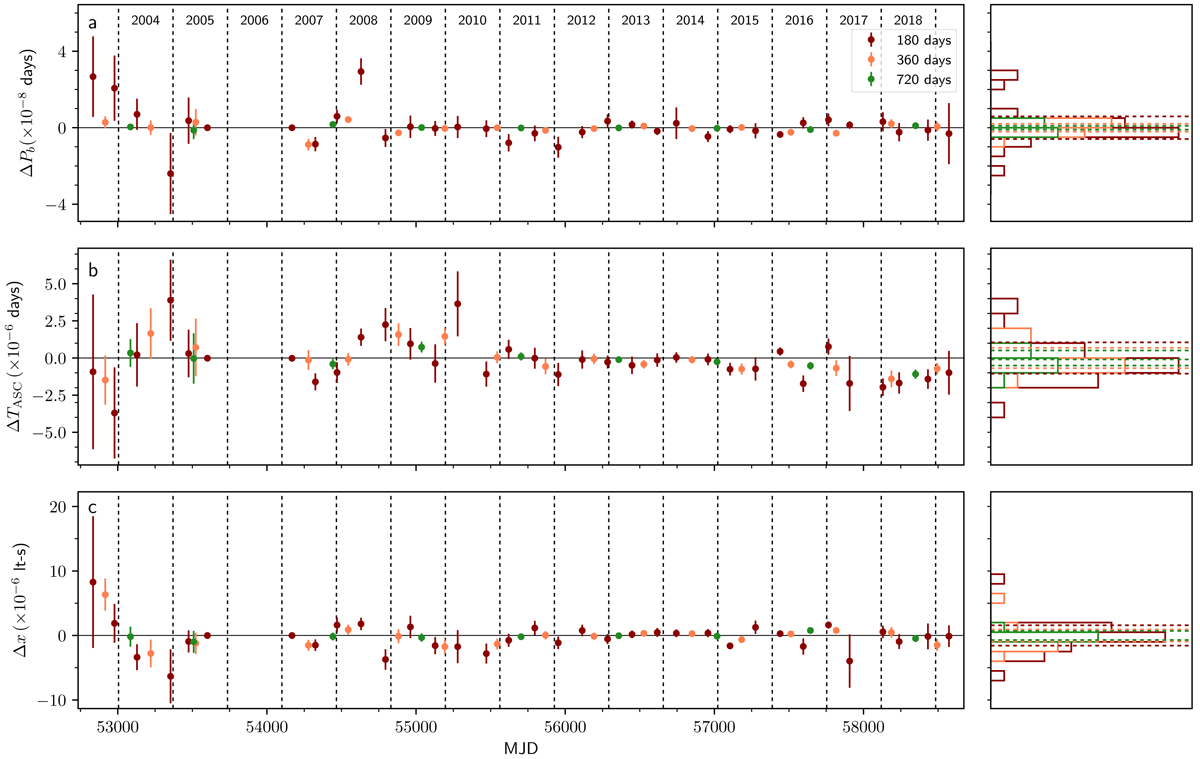
Fig. 2.
Download original image
Constraints on orbital variations. Variations in the orbital period ΔPb (panel a), the epoch of the ascending node ΔTASC (panel b), and the projected semi-major axis of the orbit Δx (panel c) are plotted against time for 180-, 360-, and 720-day segments. Here ΔPb = 0 refers to the orbital period in Table 2 found for the full span and similarly for the other parameters. The right-hand panels show distributions of the variations for each segment length. The dotted lines denote the mean of the uncertainty on the measurements. The uncertainties are generally of the same order of magnitude as the standard deviations on the variations and the measurements do not show any clear trends.
Current usage metrics show cumulative count of Article Views (full-text article views including HTML views, PDF and ePub downloads, according to the available data) and Abstracts Views on Vision4Press platform.
Data correspond to usage on the plateform after 2015. The current usage metrics is available 48-96 hours after online publication and is updated daily on week days.
Initial download of the metrics may take a while.