Fig. A.1
Download original image
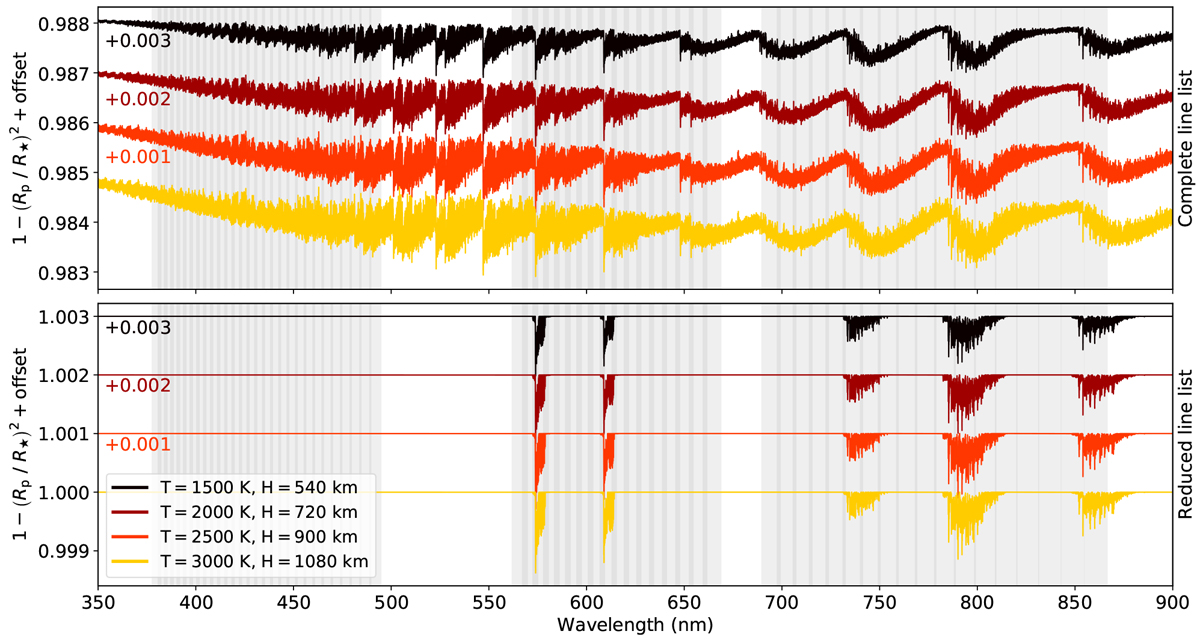
Examples of VO model transmission spectra using an abundance of VMR = 10−6.6. The top panel shows the spectra generated with the complete line list and the bottom panel used the pseudo-continuum correction described in Sect. 2.4 to create transmission spectra of the reduced line list. The four temperatures used in the presented analysis are shown with different colours and are offset for easier comparison. The grey vertical bands in both panels show the wavelength ranges of the UVES spectral orders.
Current usage metrics show cumulative count of Article Views (full-text article views including HTML views, PDF and ePub downloads, according to the available data) and Abstracts Views on Vision4Press platform.
Data correspond to usage on the plateform after 2015. The current usage metrics is available 48-96 hours after online publication and is updated daily on week days.
Initial download of the metrics may take a while.