Fig. 5
Download original image
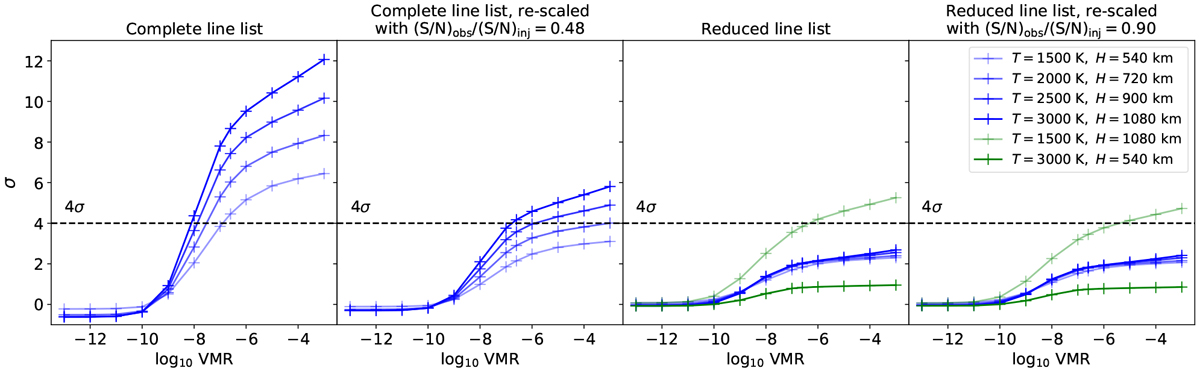
Detection significance of the injected signal versus log10 VMR for each model configuration. Left panel: recovered signal using all quantum transitions. Second panel: same signal multiplied by 0.48 as found in Sect. 2.1. Third panel: recovered signal using specific quantum transitions and the fourth panel shows the same signal multiplied by 0.90 as obtained in Sect. 2.4. The considered temperatures are displayed as different shades of blue. Two rightmost panels: detection significances of models with T = 1500 K, H = 1080 km, and T = 3000 K, H = 540 km in light green and dark green, respectively. The horizontal dashed lines at 4σ represent our detection thresholds.
Current usage metrics show cumulative count of Article Views (full-text article views including HTML views, PDF and ePub downloads, according to the available data) and Abstracts Views on Vision4Press platform.
Data correspond to usage on the plateform after 2015. The current usage metrics is available 48-96 hours after online publication and is updated daily on week days.
Initial download of the metrics may take a while.