Fig. 4
Download original image
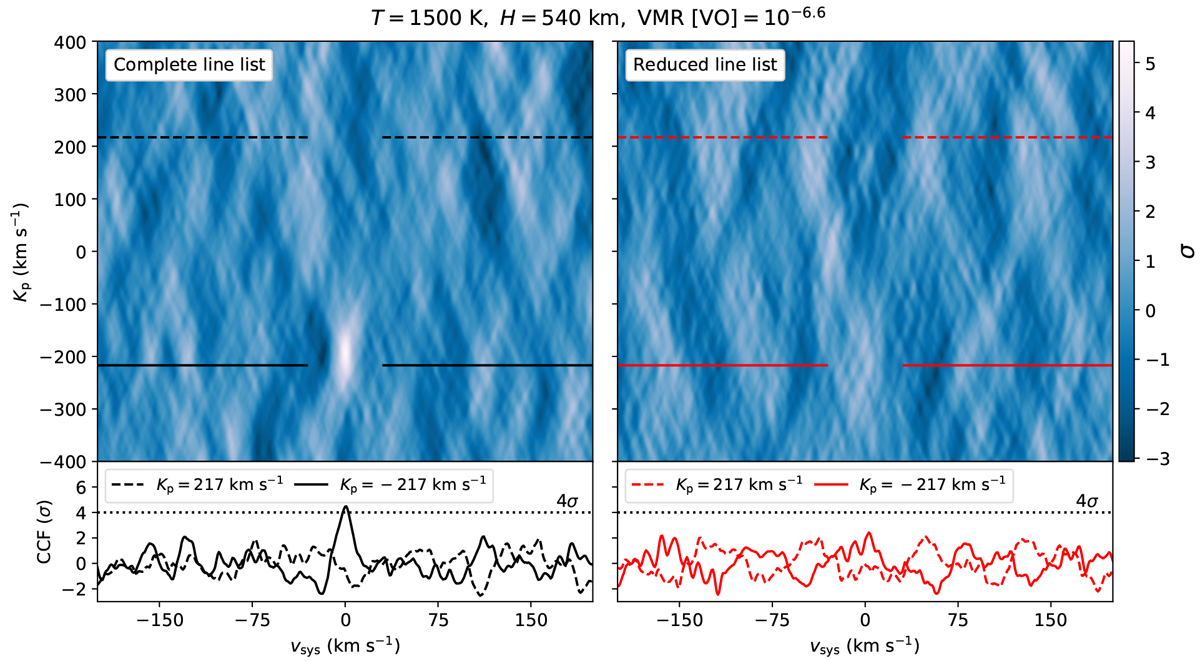
Cross-correlation analysis of WASP-121b’s UVES transmission spectra, using the model parameters reported by Evans et al. (2018). Left panels: analysis with the complete line list and the right panels use the reduced line list described in Sect. 2.4. Top panels: Kp-υsγs maps and the bottom panels show horizontal slices of these maps at the expected planet velocity Kp = 217 km s−1 (dashed) and at the injection velocity Kp = −217 km s−1 (solid).
Current usage metrics show cumulative count of Article Views (full-text article views including HTML views, PDF and ePub downloads, according to the available data) and Abstracts Views on Vision4Press platform.
Data correspond to usage on the plateform after 2015. The current usage metrics is available 48-96 hours after online publication and is updated daily on week days.
Initial download of the metrics may take a while.