Fig. 3
Download original image
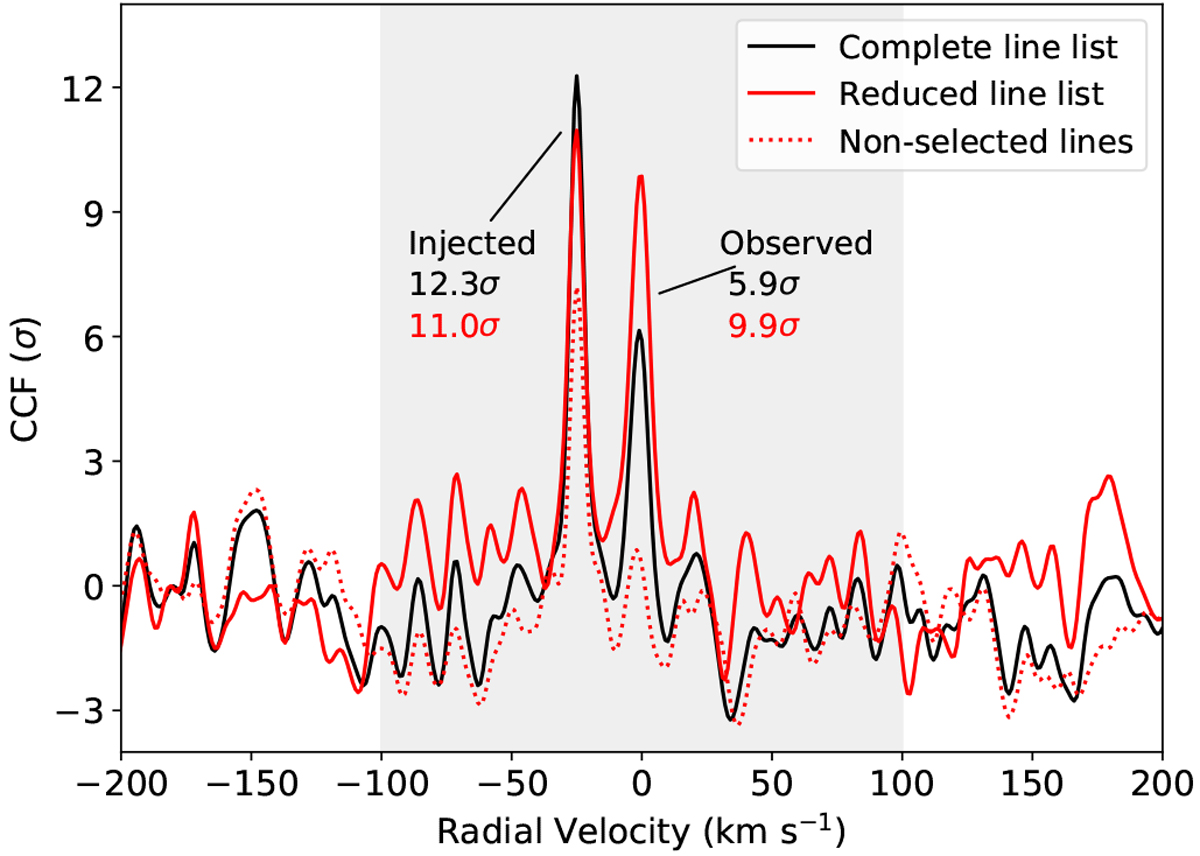
Combined CCFs from every UVES-sized order after the VO injection. The black line shows the CCF using the complete VO line list. The solid and dotted red lines show the CCF using the reduced line list described in Sect. 2.4 and the CCF using the non-selected transitions, respectively. The grey region depicts the excluded velocity range used to determine the noise level in the CCF. The peaks at −25 and 0 km s−1 are the injected and observed signals, respectively.
Current usage metrics show cumulative count of Article Views (full-text article views including HTML views, PDF and ePub downloads, according to the available data) and Abstracts Views on Vision4Press platform.
Data correspond to usage on the plateform after 2015. The current usage metrics is available 48-96 hours after online publication and is updated daily on week days.
Initial download of the metrics may take a while.