Fig. 2
Download original image
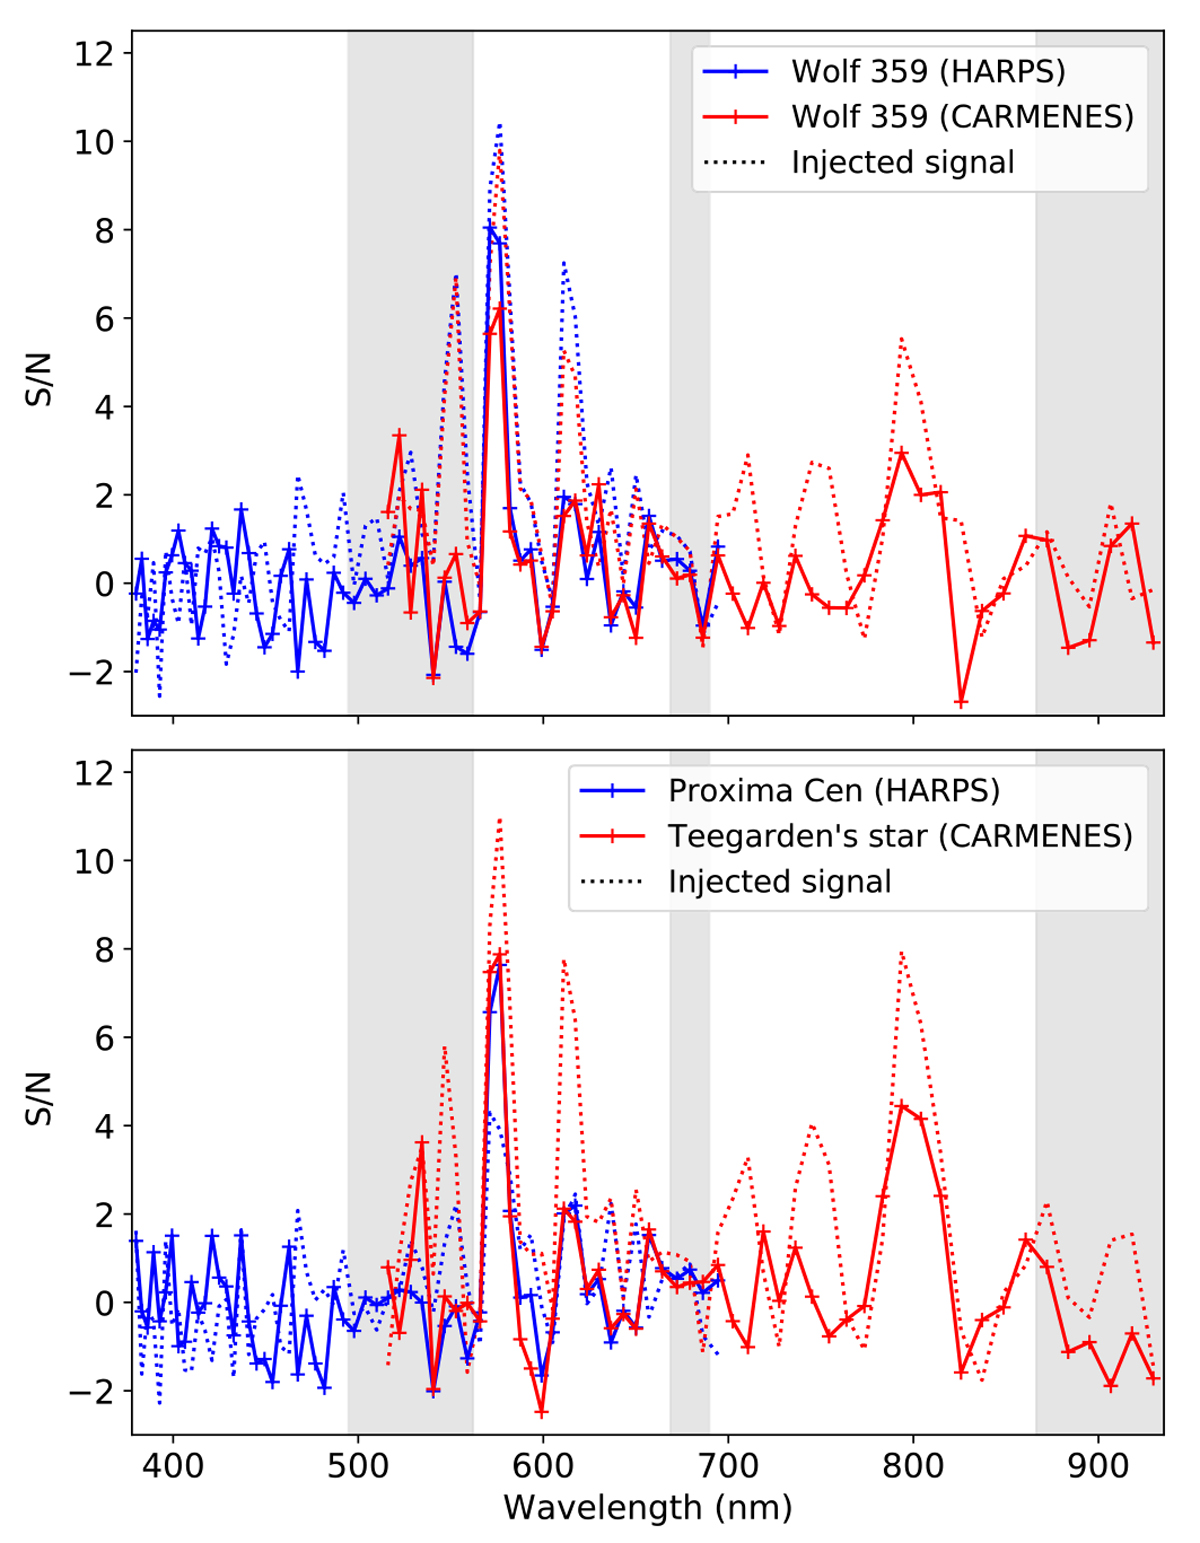
Cross-correlation S/N between the ExoMol VO line list and M-dwarf spectra for each UVES-sized spectral order. The solid and dotted lines depict the observed and injected signals, respectively. Top panel: cross-correlation with the HARPS and CARMENES spectra of Wolf 359. Bottom panel: cross-correlation with the HARPS spectrumof Proxima Centauri and the CARMENES spectrum of Teegarden’s star. The grey vertical bands are regions which are not covered by the UVES spectrograph.
Current usage metrics show cumulative count of Article Views (full-text article views including HTML views, PDF and ePub downloads, according to the available data) and Abstracts Views on Vision4Press platform.
Data correspond to usage on the plateform after 2015. The current usage metrics is available 48-96 hours after online publication and is updated daily on week days.
Initial download of the metrics may take a while.