Fig. 1
Download original image
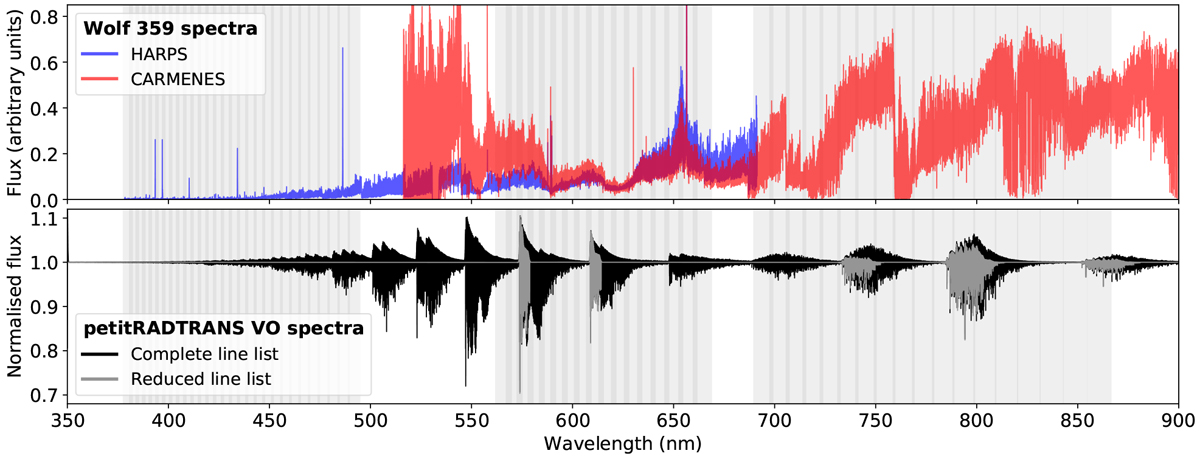
Comparison between the observed M-dwarf spectra and the petitRADTRANS VO model spectra. Top panel: HARPS and CARMENES spectra of Wolf 359 in blue and red, respectively. Bottom panel: normalised VO model spectra using all quantum transitions in black and using the specific transitions described in Sect. 2.4 in grey. The grey vertical bands in both panels show the wavelength ranges of the UVES spectral orders.
Current usage metrics show cumulative count of Article Views (full-text article views including HTML views, PDF and ePub downloads, according to the available data) and Abstracts Views on Vision4Press platform.
Data correspond to usage on the plateform after 2015. The current usage metrics is available 48-96 hours after online publication and is updated daily on week days.
Initial download of the metrics may take a while.