Fig. 6.
Download original image
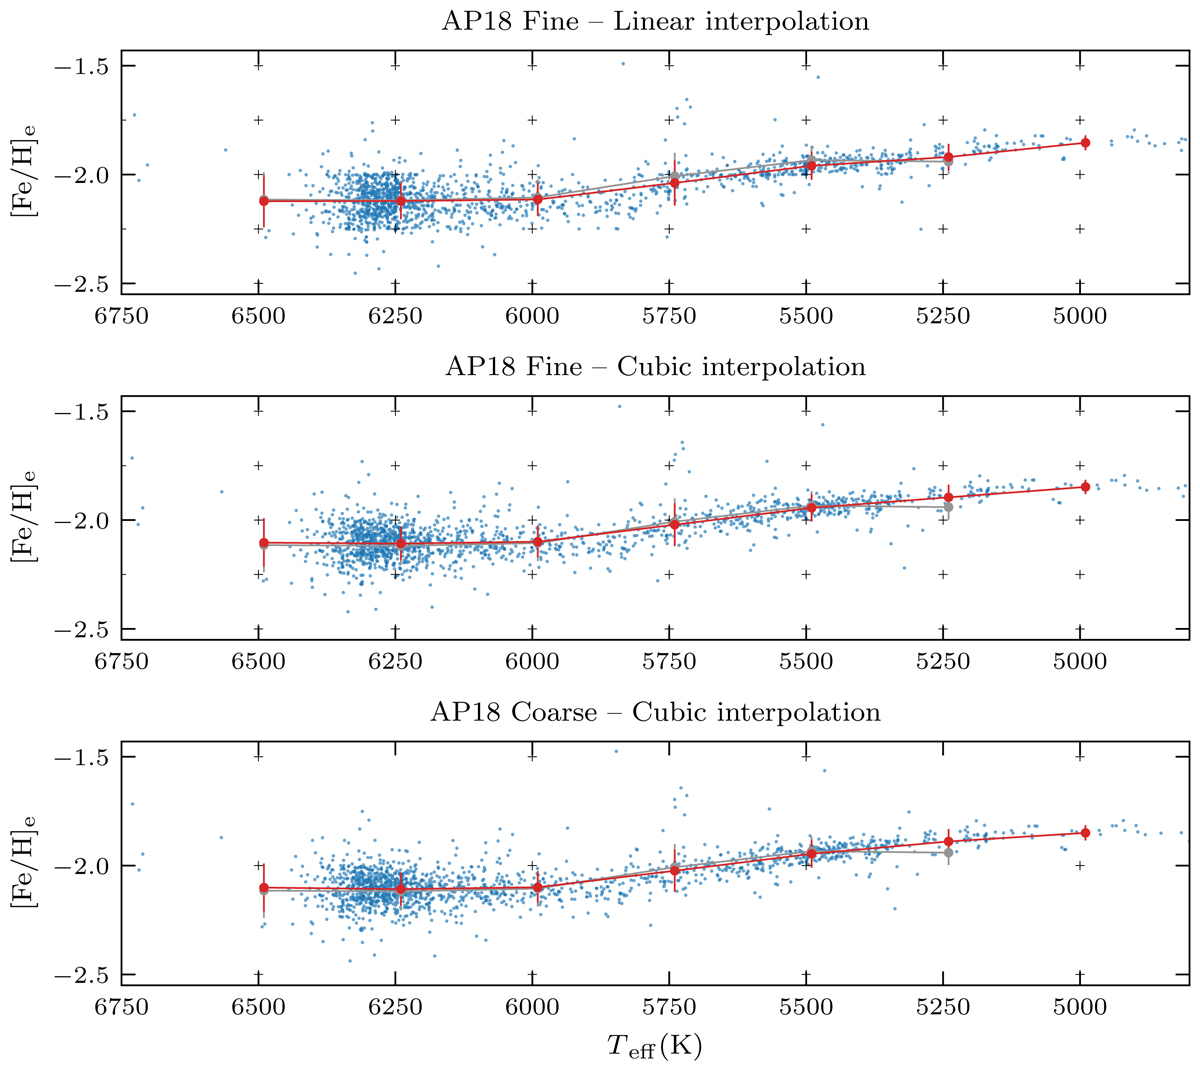
[Fe/H]e vs. Teff relation using the AP18 fine (top and second panels) and coarse (third panel) grids. The top panel shows the linear interpolation, and the two other panels show the cubic interpolation. The grey lines and symbols represent the solution (with an offset of −0.076) obtained with the GSL grid (cubic interpolation) and reported on Fig. 4. The other symbols and line styles are as in Fig. 4.
Current usage metrics show cumulative count of Article Views (full-text article views including HTML views, PDF and ePub downloads, according to the available data) and Abstracts Views on Vision4Press platform.
Data correspond to usage on the plateform after 2015. The current usage metrics is available 48-96 hours after online publication and is updated daily on week days.
Initial download of the metrics may take a while.