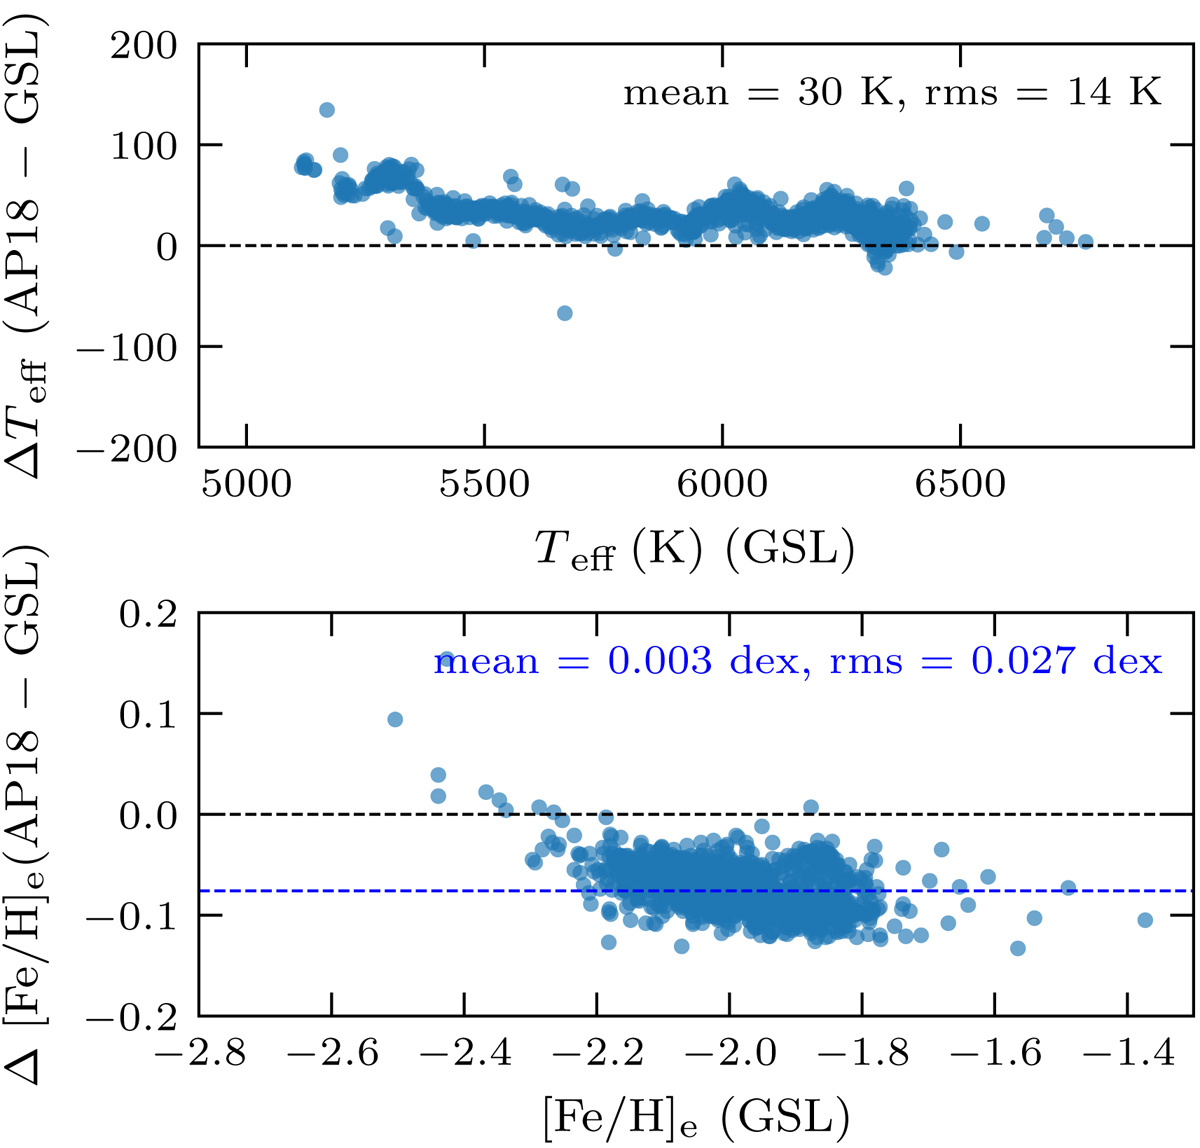
Fig. 5.
Download original image
Comparison between Teff and [Fe/H]e obtained with GSL and AP18 grids. Top panel: difference between Teff (ΔTeff(AP18-GSL), computed by subtracting the GSL results from the AP18 results) as a function of Teff values with GSL. Bottom panel: difference of equivalent iron abundance (Δ[Fe/H]e) as a function of the iron abundance with GSL. The dashed blue line shows the expected bias due to the different level of α-element enhancement in the two grids (0.4 vs. 0.5 dex, see the text for details). In both panels we report the mean and rms of the differences.
Current usage metrics show cumulative count of Article Views (full-text article views including HTML views, PDF and ePub downloads, according to the available data) and Abstracts Views on Vision4Press platform.
Data correspond to usage on the plateform after 2015. The current usage metrics is available 48-96 hours after online publication and is updated daily on week days.
Initial download of the metrics may take a while.