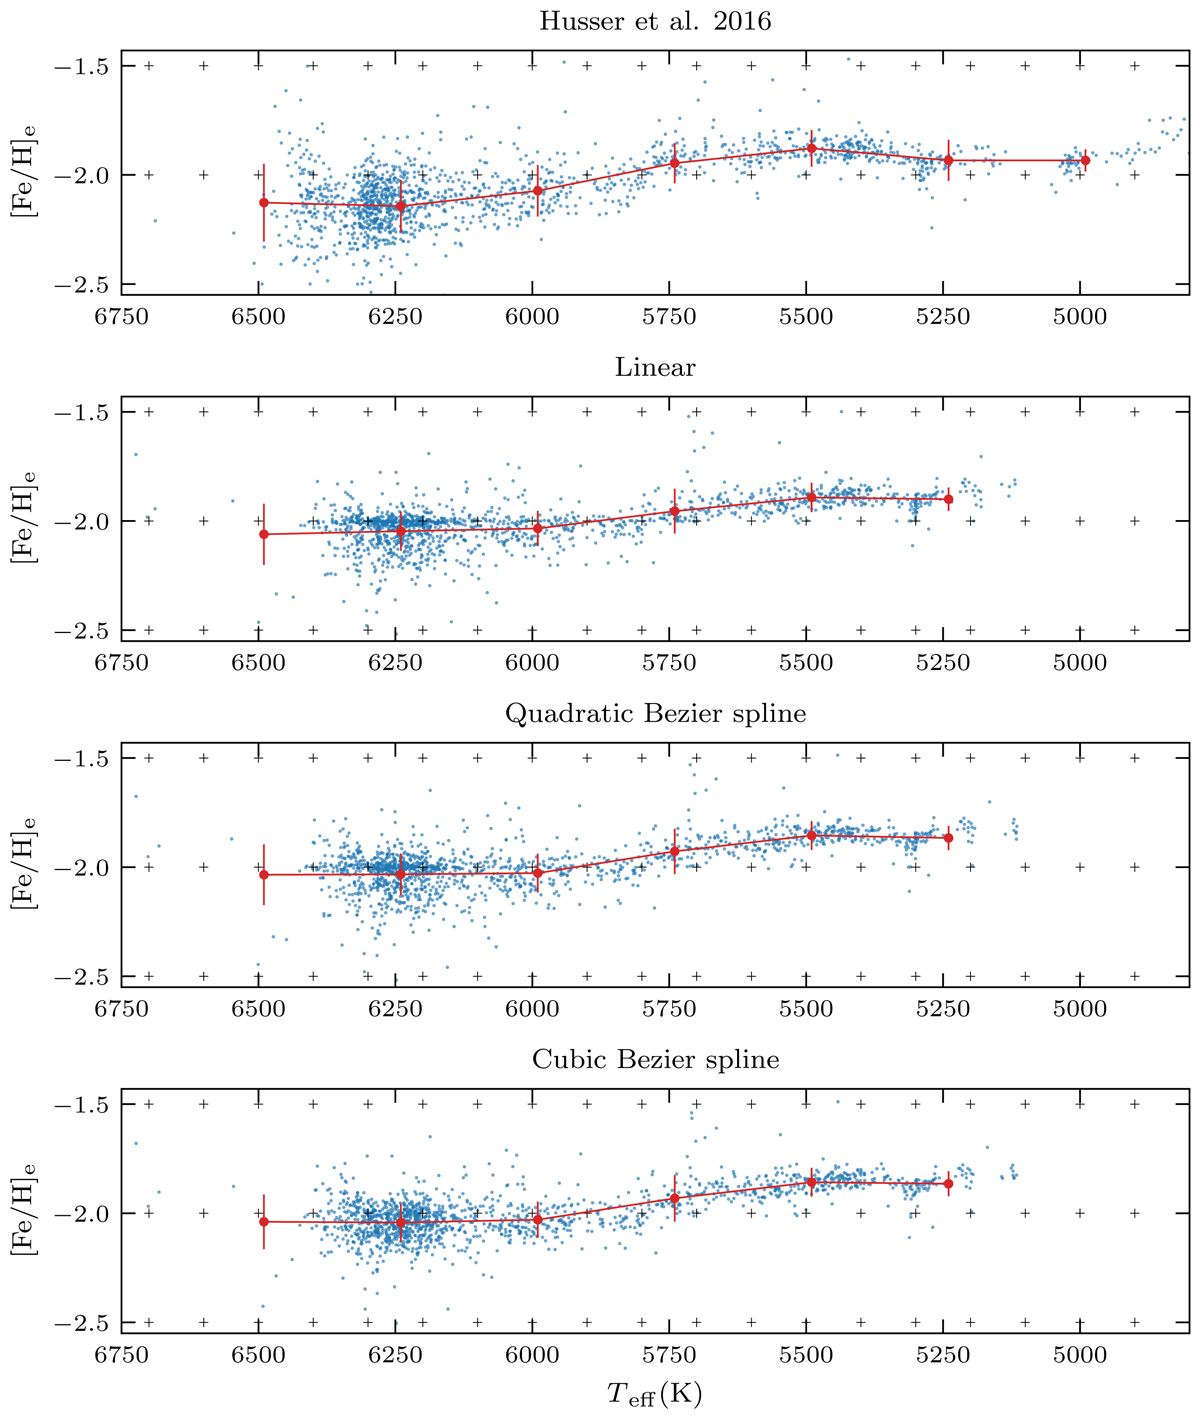
Fig. 4.
Download original image
[Fe/H]e vs. Teff diagrams published in H16 (top panel, with [α/Fe] = 0) and those obtained with FERRE using GSL and the three different interpolation schemes (other panels, with [α/Fe] = +0.4). The measurements of individual spectra are shown as blue dots, and the nodes of the grids are overlaid as thin crosses. The red dots and line are the mean [Fe/H]e in bins of 250 K, and the error bars are the dispersion in these bins.
Current usage metrics show cumulative count of Article Views (full-text article views including HTML views, PDF and ePub downloads, according to the available data) and Abstracts Views on Vision4Press platform.
Data correspond to usage on the plateform after 2015. The current usage metrics is available 48-96 hours after online publication and is updated daily on week days.
Initial download of the metrics may take a while.