Fig. 2.
Download original image
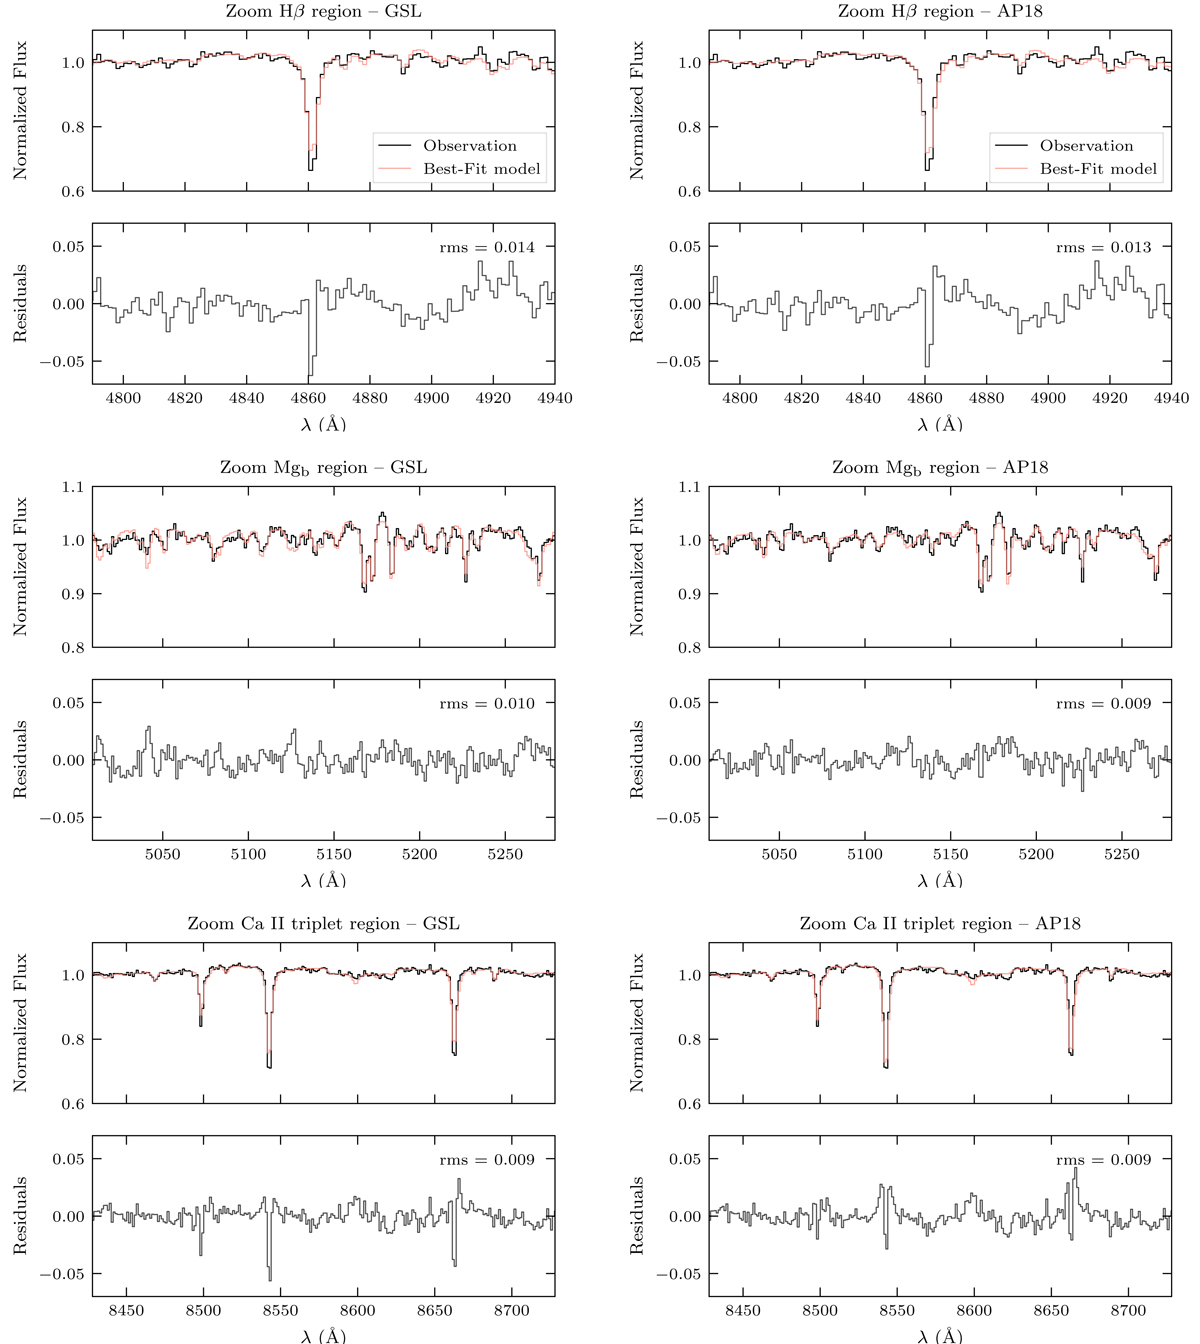
Typical fits of a spectrum (ID = id000010747jd2456866p4985f000). The fit, performed over the complete wavelength range, 4750–9300 Å, returned Teff = 5471 K and [Fe/H]e = −1.84 dex for global rms residuals of 0.01 for both GSL and AP18. The left column shows the [α/Fe] = 0.4 dex GSL grid, and the right column presents the [α/Fe] = 0.5 dex fine AP18 grid. The top row shows a small wavelength region around the Hβ line, the middle row shows a region around the Mgb triplet, and the bottom one shows a region around the Ca II triplet. For each plot, the top panel presents the observation (black line) with the best-fit model over-plotted in red. The bottom panel presents the residuals, observation minus model.
Current usage metrics show cumulative count of Article Views (full-text article views including HTML views, PDF and ePub downloads, according to the available data) and Abstracts Views on Vision4Press platform.
Data correspond to usage on the plateform after 2015. The current usage metrics is available 48-96 hours after online publication and is updated daily on week days.
Initial download of the metrics may take a while.