Fig. 1.
Download original image
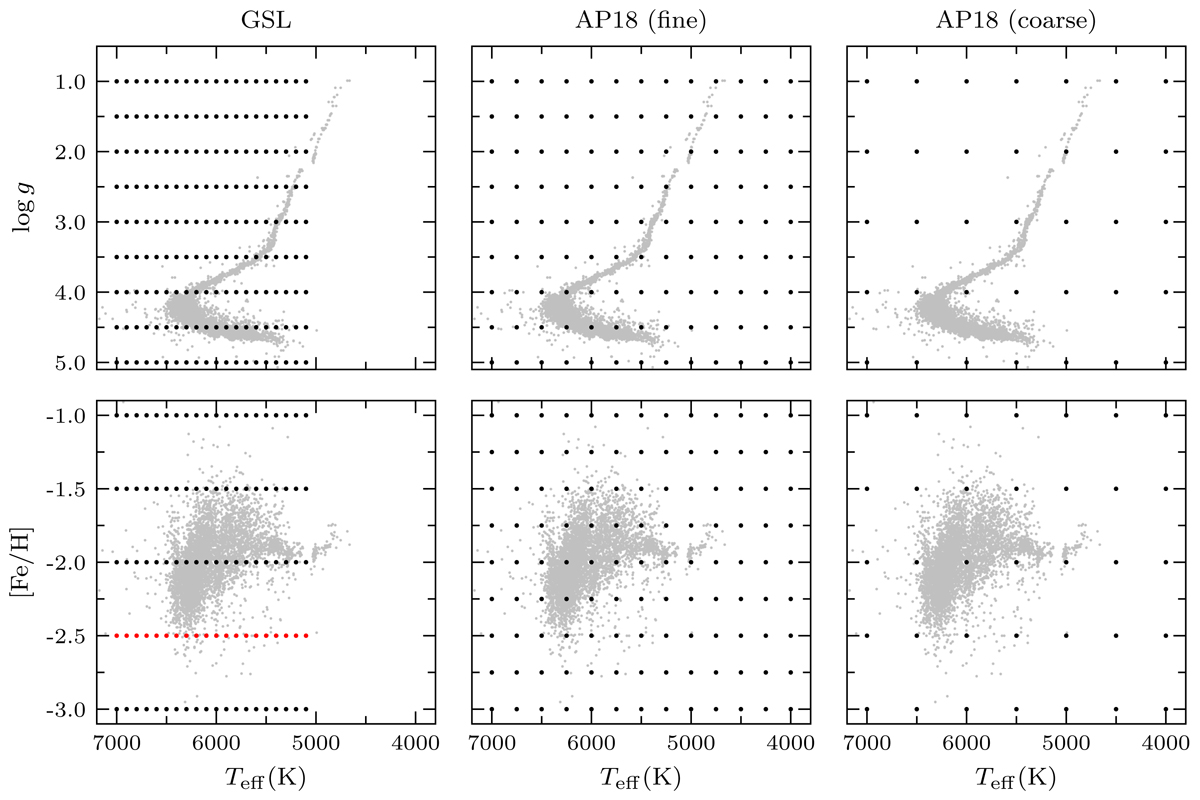
Parameter space coverage of the grids. The grey dots represent the analysed sample, and the black dots mark the nodes of the grids of synthetic spectra. The top panels are the projections on the log g vs. Teff plane, and the bottom panels show the projections in [Fe/H] vs. Teff. The left column is for the GSL (the [Fe/H] = −2.5 dex slice, which is not originally a part of GSL, and is produced by averaging the [Fe/H] = −3 dex and [Fe/H] = −2 dex slices, see Sect. 4). The central column is the AP18 grid (see Sect. 5). The right column is also from the AP18 grid, but with twice larger steps on each axis to evaluate the effect of a coarser grid (see Sect. 5.2).
Current usage metrics show cumulative count of Article Views (full-text article views including HTML views, PDF and ePub downloads, according to the available data) and Abstracts Views on Vision4Press platform.
Data correspond to usage on the plateform after 2015. The current usage metrics is available 48-96 hours after online publication and is updated daily on week days.
Initial download of the metrics may take a while.