Fig. 6.
Download original image
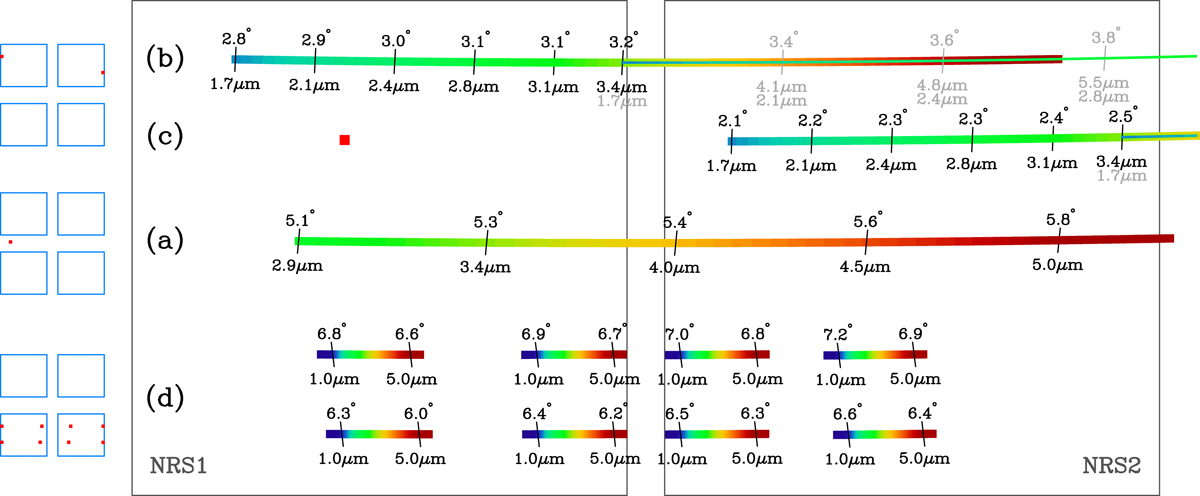
Representative traces of spectra on the NIRSpec detector. The two large squares mark the outer boundaries of the active areas of the two detector arrays. The orientation of this figure matches that of the Slit Plane shown in Fig. 4, such that spectra shift left and right and up and down in the same sense as the Fixed Slit or MSA shutter employed. The traces span the full wavelength band covered by each disperser and are widened for clarity. Fiducial wavelengths and the magnitude of the slit tilt are indicated along each trace. For grating spectra their red extensions are also shown with the portions contaminated by second-order light overdrawn with a thinner line. (a) G395H/F290LP, R = 2700 Band III spectrum from the S200A2 Fixed Slit. (b) G235M/F170LP R = 1000 Band II spectrum from shutter (3,355,50) on the extreme left side of MSA quadrant Q3. (c) G235M/F170LP, R = 1000 Band II spectrum from shutter (1,10,115) at the opposite side of the opposing MSA quadrant Q1. The filled red square shows the location of the zero order image. (d) Eight R = 100 prism spectra from shutters (2,10,50), (2,265,50), (2,10,115) and (2,280,115) of quadrant Q2 and shutters (4,40,50), (4,355,50), (4,53,115) and (4,355,115) of the opposing quadrant Q4.
Current usage metrics show cumulative count of Article Views (full-text article views including HTML views, PDF and ePub downloads, according to the available data) and Abstracts Views on Vision4Press platform.
Data correspond to usage on the plateform after 2015. The current usage metrics is available 48-96 hours after online publication and is updated daily on week days.
Initial download of the metrics may take a while.