Free Access
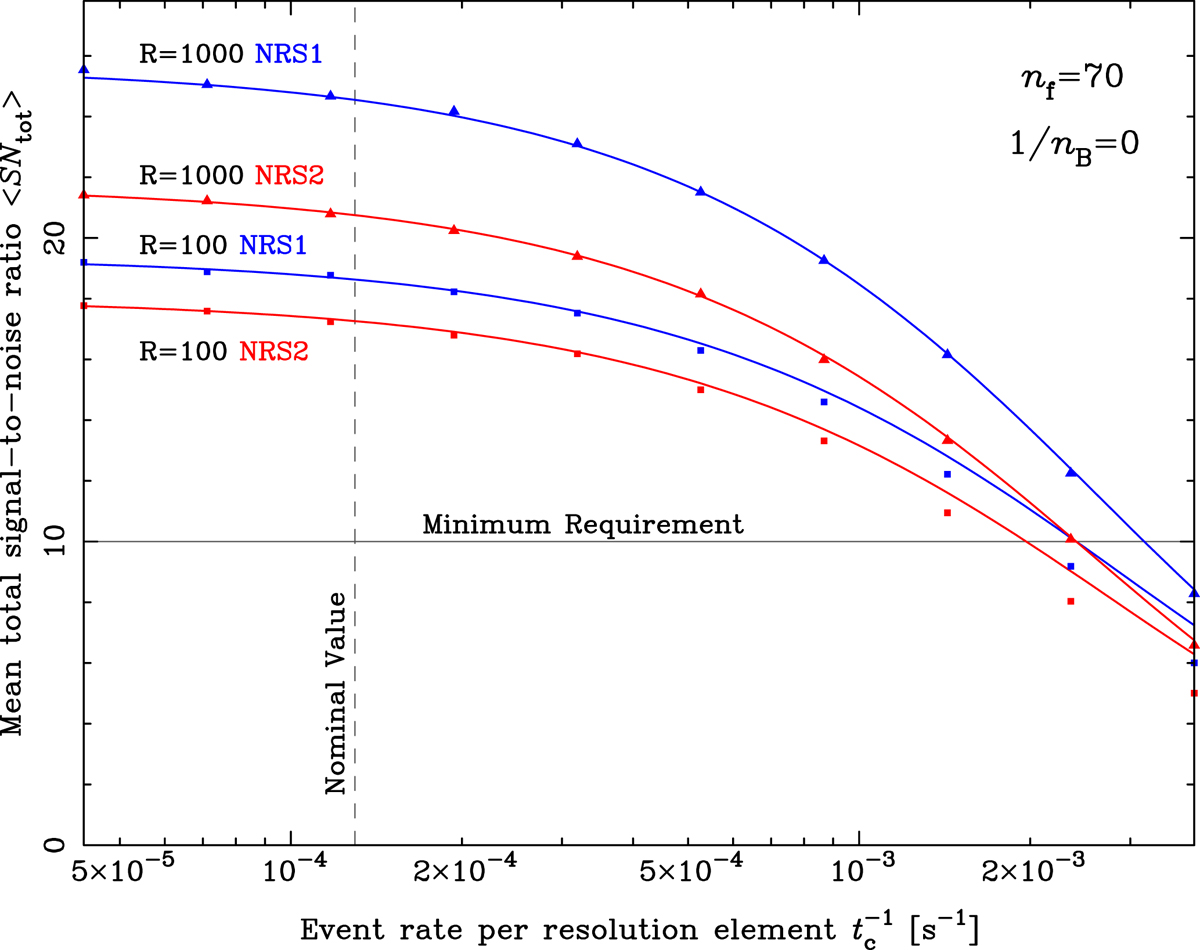
Fig. A.4.
Download original image
Mean total signal-to-noise ratio achievable in the two benchmark observations when employing NRSIRS2RAPID subimages spanning ng = 70, m = 1 groups plotted against the incident cosmic ray event rate in a resolution element. The triangles and squares mark the outcomes of matching Monte Carlo simulations
Current usage metrics show cumulative count of Article Views (full-text article views including HTML views, PDF and ePub downloads, according to the available data) and Abstracts Views on Vision4Press platform.
Data correspond to usage on the plateform after 2015. The current usage metrics is available 48-96 hours after online publication and is updated daily on week days.
Initial download of the metrics may take a while.