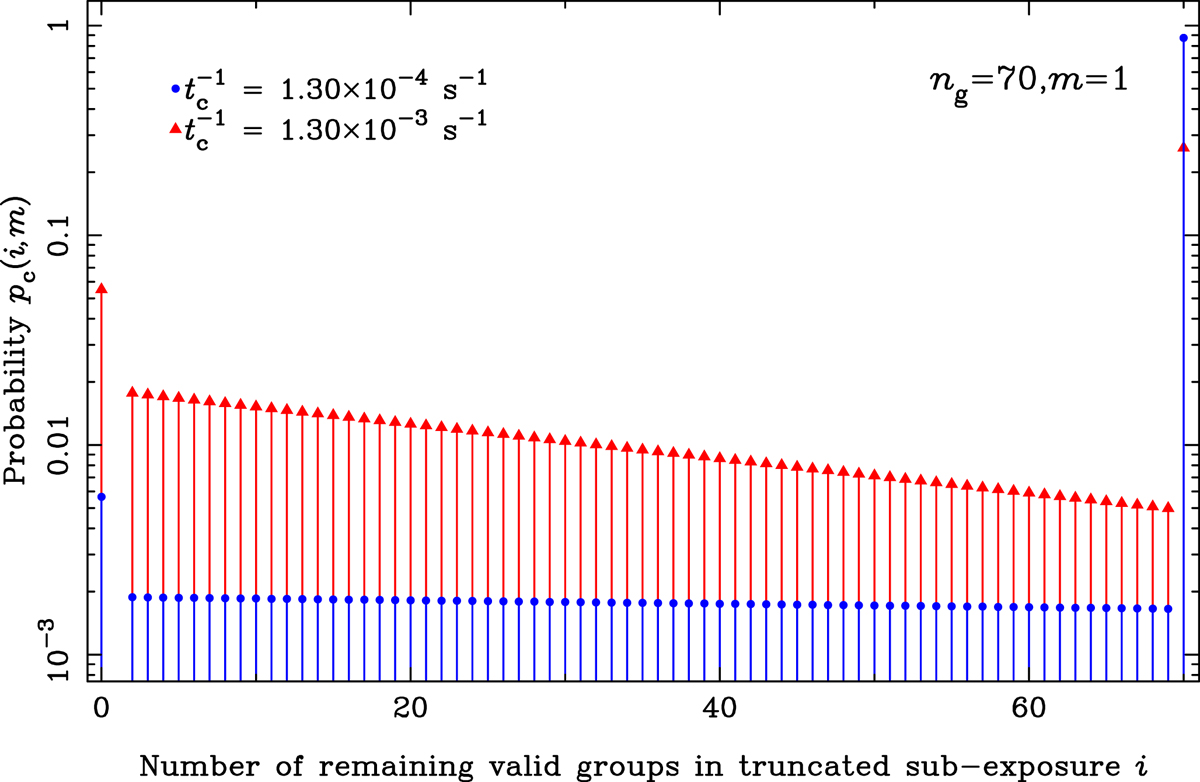
Fig. A.3.
Download original image
Probability that an exposure ramp extending over ng = 70, m = 1 groups runs to ñg = i valid reads before the resolution element spanning 8 detector pixels is hit by a cosmic ray. The blue circles are for the nominal assumed cosmic ray incidence rate. The red triangles are for a ten times higher event rate. Note the logarithmic ordinate scale.
Current usage metrics show cumulative count of Article Views (full-text article views including HTML views, PDF and ePub downloads, according to the available data) and Abstracts Views on Vision4Press platform.
Data correspond to usage on the plateform after 2015. The current usage metrics is available 48-96 hours after online publication and is updated daily on week days.
Initial download of the metrics may take a while.