Fig. 9.
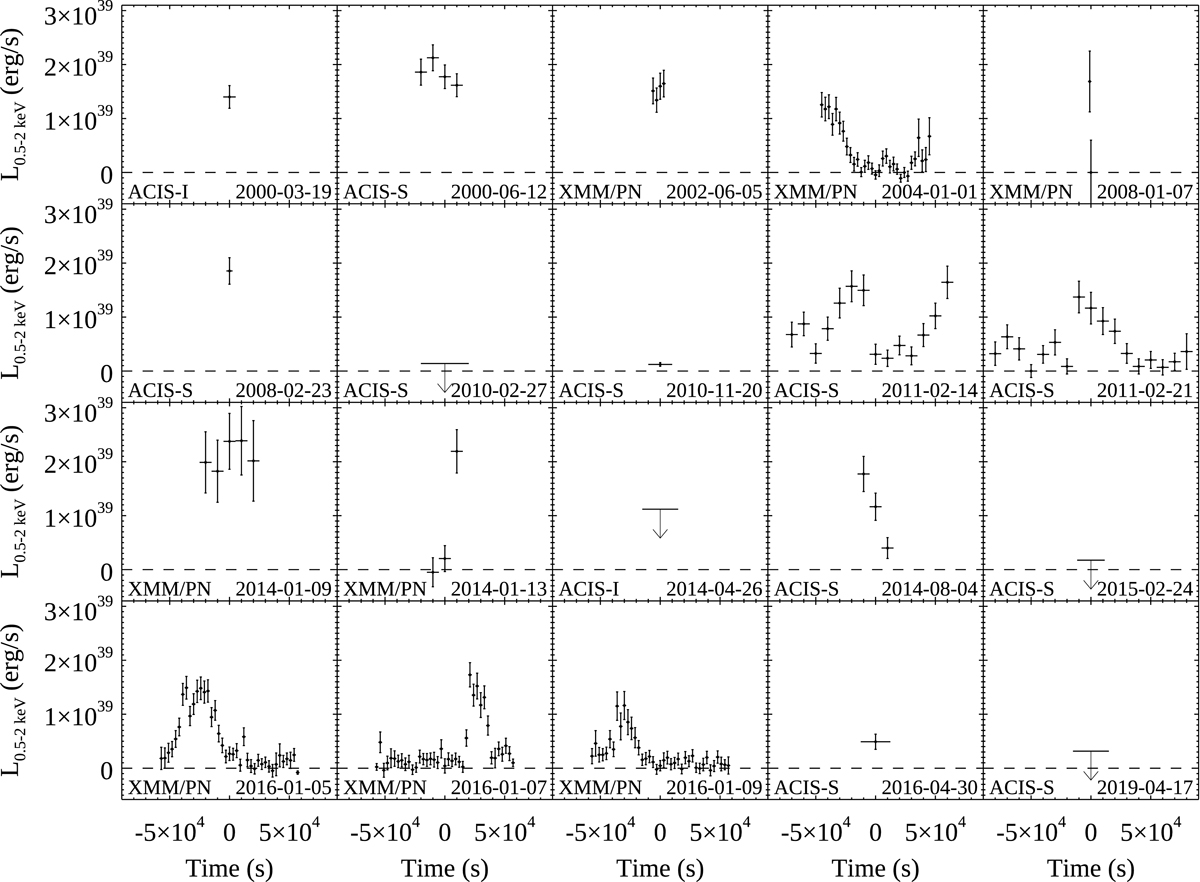
Download original image
Light curves and 3σ upper limits of XMMU J122939.7+075333 in luminosity units for all the XMM-Newton and Chandra observations in Table 1. The conversion from 0.5–2 keV count rates into luminosity in the 0.5–2 keV energy band was based on the best-fit parameters of the average spectrum for each observation. The upper limits were derived from the 0.3–2 keV count-rate limits in Table 1 assuming the best-fit spectral parameters of the first flare detected in 2016 (Table 2). Although Dage et al. (2019) report a 3σ detection in the 2019 observation, we set an upper limit because most of the counts were detected above 2 keV. The horizontal bars indicate either the bin size of the light curve (ranging from 1 to 10 ks) or the observation exposure time (for upper limits and observations with a single time bin). The start dates of the observations and the instrument are indicated in each panel.
Current usage metrics show cumulative count of Article Views (full-text article views including HTML views, PDF and ePub downloads, according to the available data) and Abstracts Views on Vision4Press platform.
Data correspond to usage on the plateform after 2015. The current usage metrics is available 48-96 hours after online publication and is updated daily on week days.
Initial download of the metrics may take a while.