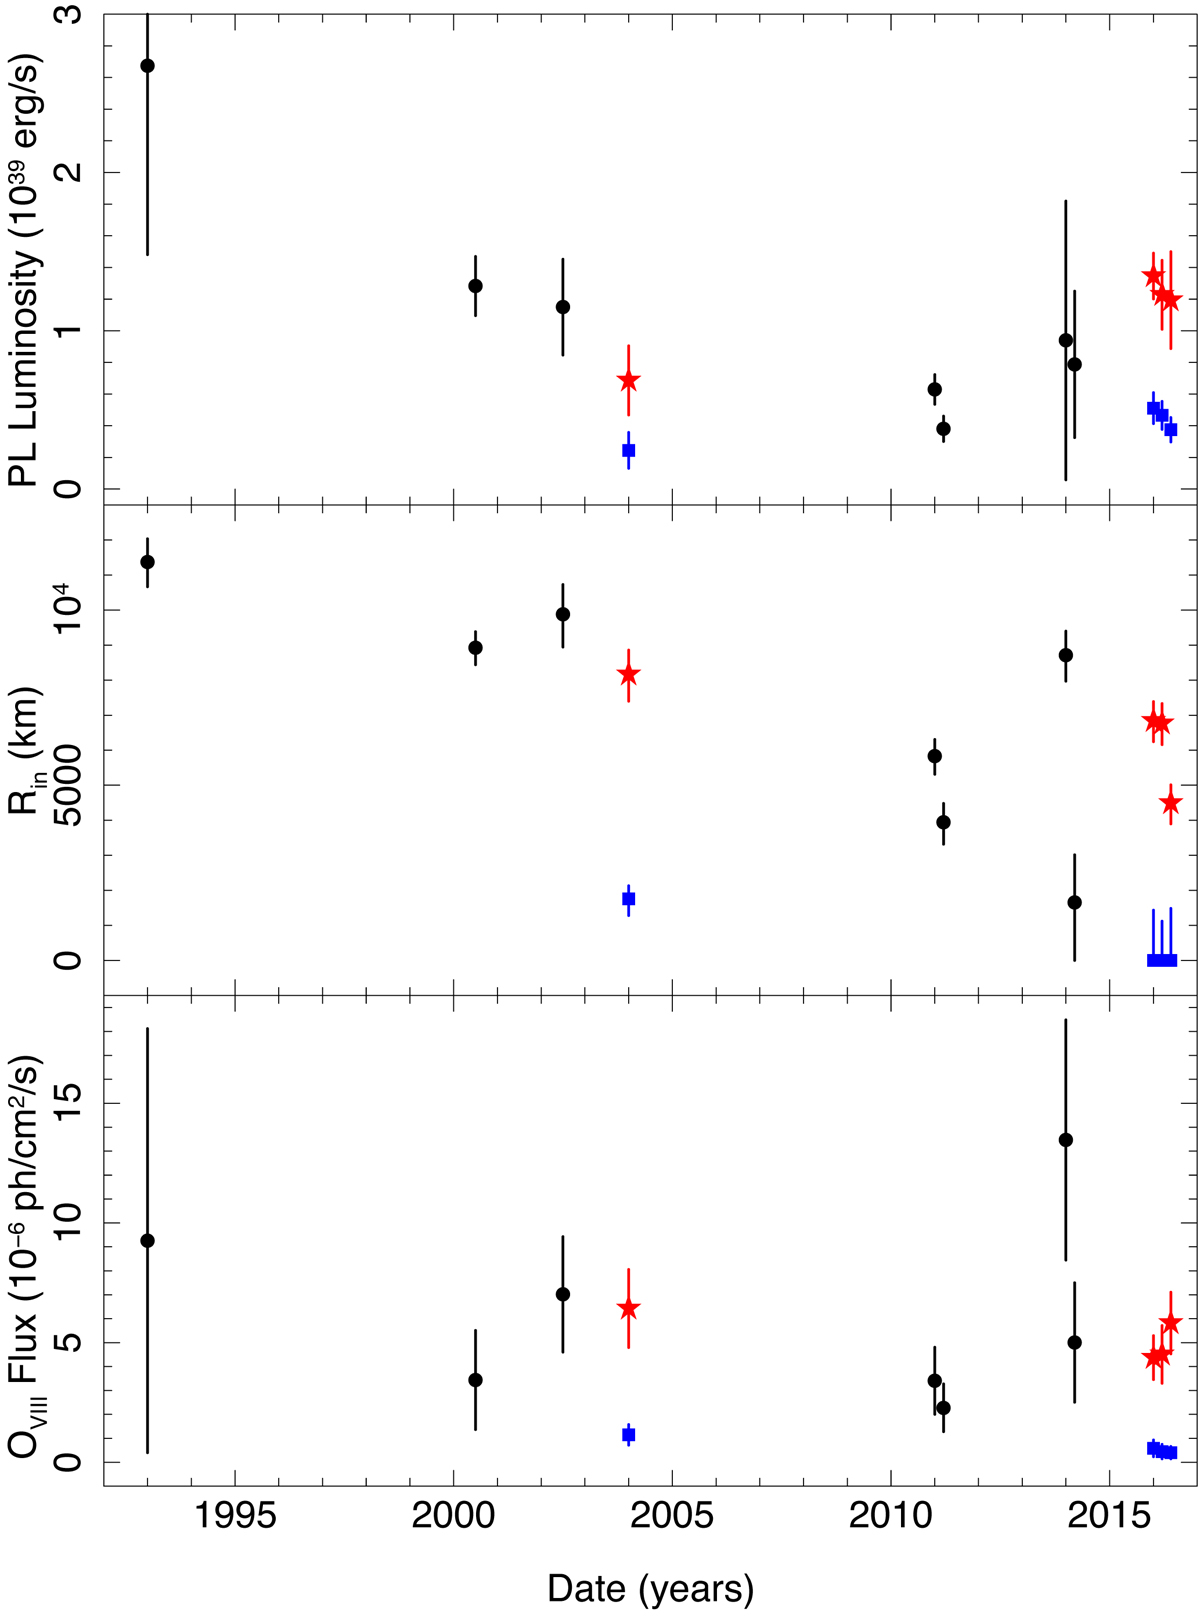
Fig. 8.
Download original image
Time evolution of the power-law 0.3–10 keV unabsorbed luminosity (upper panel), apparent inner disk radius (middle panel; from the diskbb model in XSPEC, assuming a disk inclination of 45°) and Gaussian line flux (lower panel) obtained by fitting the available spectra with the same model as in Table 2. Spectra extracted from the full observation, flare, and quiescent time intervals are represented by black circles, red stars and blue squares, respectively. The time separations between the exposures performed during the same year have been enhanced for clarity.
Current usage metrics show cumulative count of Article Views (full-text article views including HTML views, PDF and ePub downloads, according to the available data) and Abstracts Views on Vision4Press platform.
Data correspond to usage on the plateform after 2015. The current usage metrics is available 48-96 hours after online publication and is updated daily on week days.
Initial download of the metrics may take a while.