Free Access
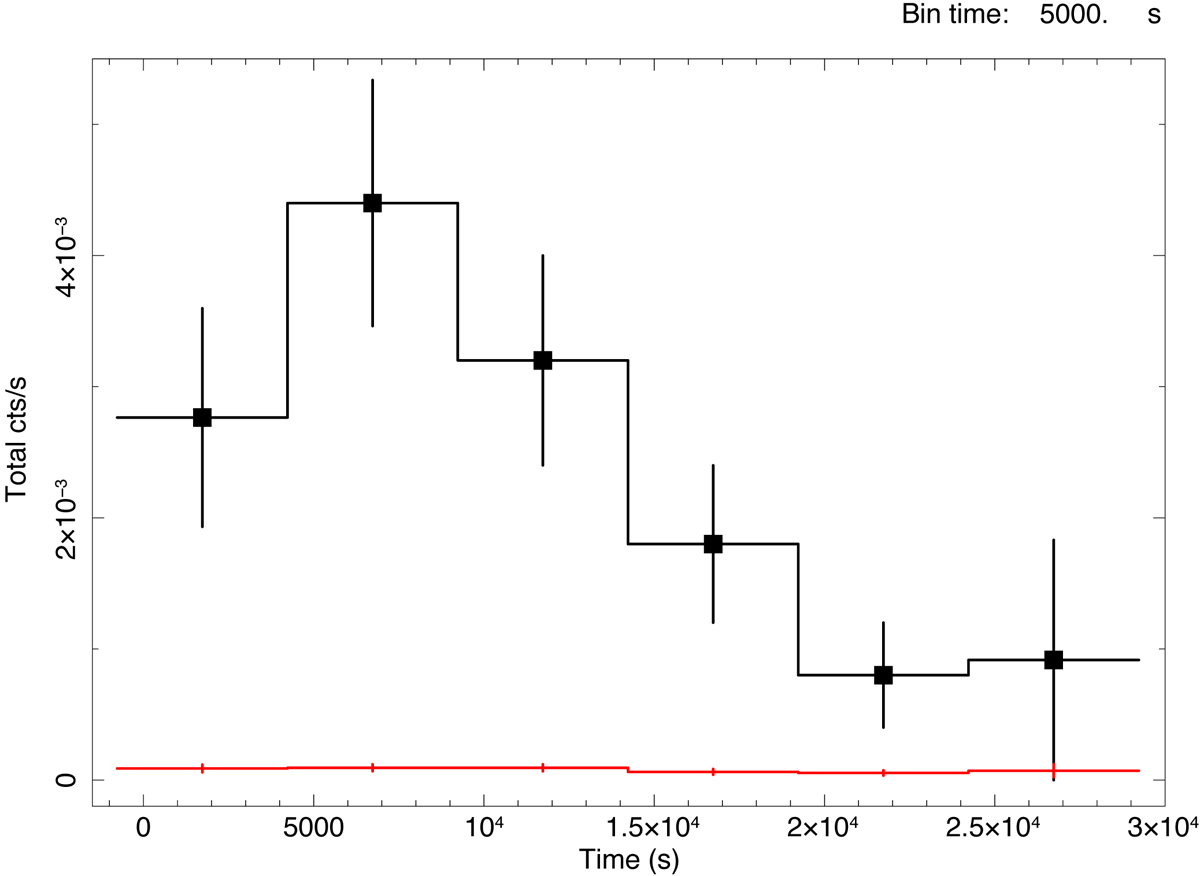
Fig. 5.
Download original image
ACIS-S light curve in the 0.3–2 keV energy band extracted from the source (black squares) and background (red) regions during observation 16260. The background count rates (and error bars) are rescaled by a factor 25 to account for the different sizes of the source and background regions.
Current usage metrics show cumulative count of Article Views (full-text article views including HTML views, PDF and ePub downloads, according to the available data) and Abstracts Views on Vision4Press platform.
Data correspond to usage on the plateform after 2015. The current usage metrics is available 48-96 hours after online publication and is updated daily on week days.
Initial download of the metrics may take a while.