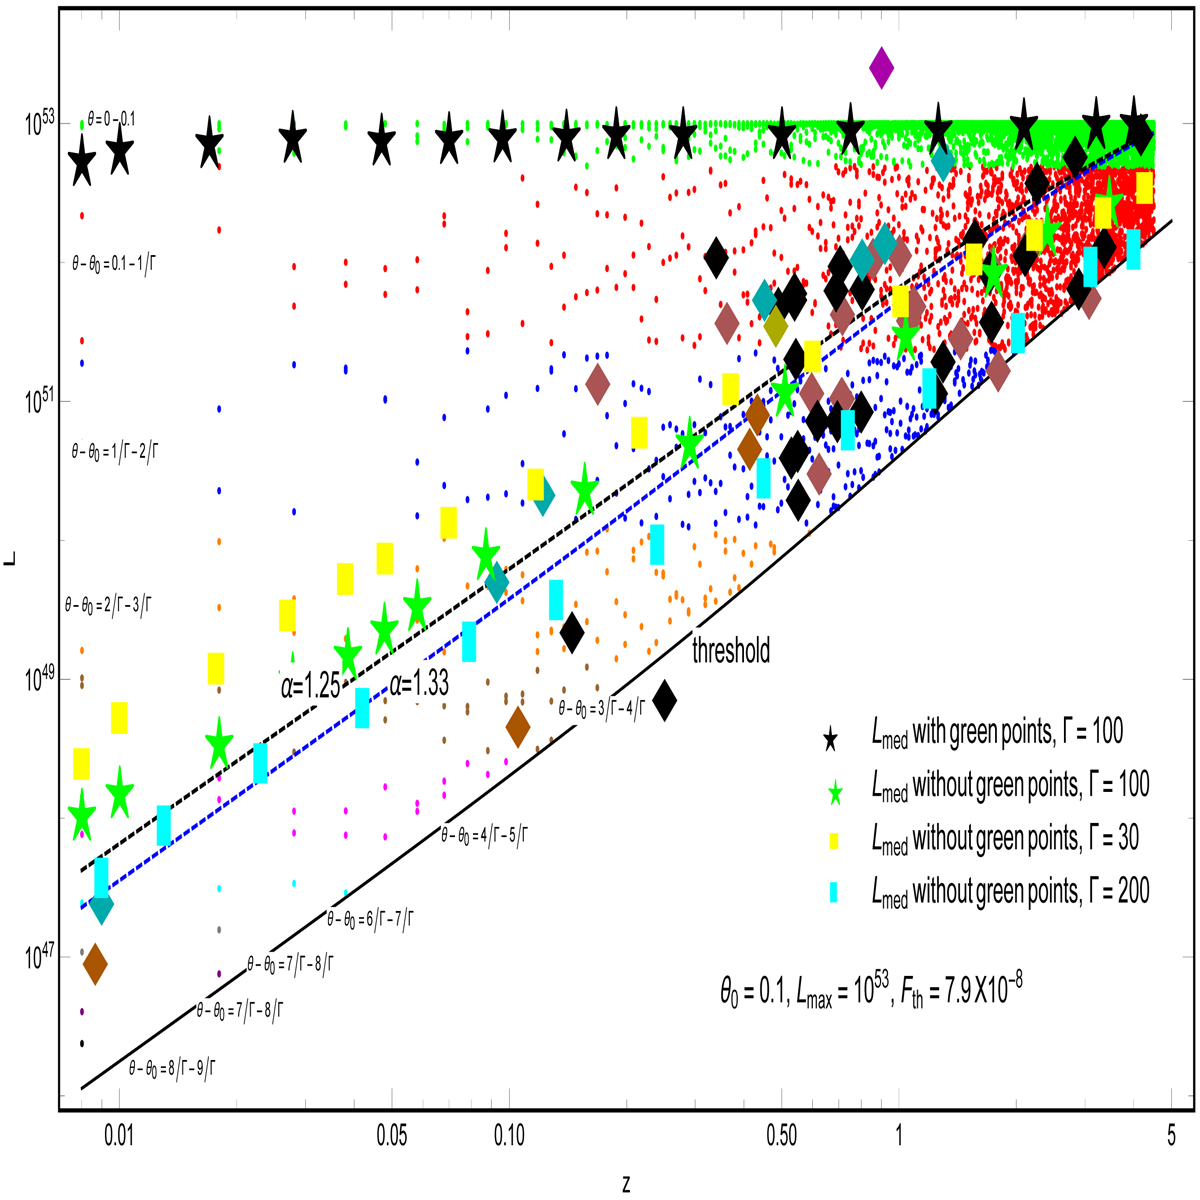
Fig. 5.
Download original image
Simulated data showing variation of L with z for different ranges of θ. The black stars correspond to the value of L(z) that divides the points equally (above and below). The green stars reflect the same L(z) but without the green points, i.e., for points outside the jet. The yellow squares and cyan rectangles represent similar points (L(z)) for Γ = 30 and Γ = 200, respectively. The other, larger diamonds correspond to the observed data (Goldstein et al. 2017; Cano et al. 2017; Michałowski et al. 2018; Gehrels et al. 2006; D’Avanzo et al. 2014) along with the nature of their afterglows (flat, monotonic, or unavailable): dark cyan = short, flat; dark magenta = flat, monotonic; dark yellow = flat, unavailable; dark pink = long, flat; black = long, monotonic; and dark orange = long, unavailable. The analytical curves for α = 1.25 (black dot-dashed) and α = 1.33 (black dashed) are also shown.
Current usage metrics show cumulative count of Article Views (full-text article views including HTML views, PDF and ePub downloads, according to the available data) and Abstracts Views on Vision4Press platform.
Data correspond to usage on the plateform after 2015. The current usage metrics is available 48-96 hours after online publication and is updated daily on week days.
Initial download of the metrics may take a while.